
[Full PDF of report is available below]
Introduction
Many have questioned the accuracy of official inflation statistics, with dozens of academic papers written on the topic and doubts voiced by sources ranging from the New York Times1 to former President Donald Trump.2
This matters not only because of the political salience of rising prices, but also because official inflation numbers are used to calculate real economic growth by adjusting nominal dollars to inflation-adjusted dollars.
In this study we aim to quantify some of the more egregious biases in inflation statistics in order to get us closer to a true understanding of inflation since 2019, hence of true economic growth since 2019.
Adjustments
The difficulty in measuring the size of a nation’s economy is two-fold.3 First, there is insufficient data to directly measure the number and size of all transactions in an economy, or to monitor all economic activity. Second, the measuring tool used (in this case, the Federal Reserve note) changes value over time. Thus, fluctuations in the nominal value of economic activity can be due to real changes in economic activity, measurement error of economic activity, or changes in the value of a currency.
The government metrics for inflation suffer from various problems which tend to underestimate the rise in prices over time. These shortcomings have been more pronounced over the last four years during a relatively rapid depreciation of the currency. This study does not attempt to address difficulties concerning measuring the nominal value of economic activity but instead offers an alternative adjustment for converting nominal growth to real growth by more accurately reflecting changes in the cost of living over time.
Bias Related to Housing
One of the most cited inflation gauges is the consumer price index (CPI). It measures the change in price for a fixed basket of goods and services over time. While the index contains a proxy for the cost of homeownership, it does not actually account for this directly. Instead, the CPI imputes this value from rents, without observing home prices or interest rates.4 Called “owners’ equivalent rent of residences,” this category has a relative importance of over 26 percent, meaning it makes up more than a quarter of the CPI.
If the costs to rent and own change commensurately over time, then this methodology will be relatively accurate. Unfortunately, the cost of owning a home has risen much faster than rents over the last four years and the CPI has grossly underestimated housing cost inflation. The cost of housing services in the National Economic Accounts published by the Bureau of Economic Analysis suffers from similar methodological problems.
Bias Related to Regulation
There are also issues with quantifying the effects of certain government regulations, which can affect hedonic adjustments that typically adjust prices downwards when government statisticians believe a product has improved.5
The difficulty of estimating such improvements can result in artificial cost reductions due to perceived benefits to the consumer that do not actually exist. For example, if it is assumed that a regulation increases the quality of a product, then even a dramatic increase in price could register as no price change or even a price decline in the national accounting which is used to compute gross domestic product (GDP).6
Bias Related to Indirect Purchases
Further challenges exist to measuring inflation and price changes when consumers are not directly charged for services, like health insurance.7 Premiums are used both to pay for the actual cost of providing the service of insurance (risk mitigation) and for medical services and commodities. The CPI neglects both, and instead imputes the cost of health insurance from the profits of health insurers.
If those profits decline because of increased costs of doing business for insurers, then this will register as a reduction in health insurance costs to consumers, even if premiums and coverage remain precisely the same. This is problematic not only because it distorts the true level of inflation but also because it affects estimates for consumer spending, artificially reducing a price index and increasing the estimate for real consumer spending and therefore overall economic activity.
Implications for Economic Growth
The phenomenon of undercounting inflation is particularly concerning today given how high the official inflation measurements have been for the last several years. The inflation itself has increased the nominal values of several key economic metrics without resulting in any real change. This is why there has been such a disparity between the rapid rise in nominal, pre-inflation GDP and the relatively slow increase in real, after-inflation GDP.8
The following data are presented in such a way as to show the reader the change in nominal and real values through the second quarter of 2024, beginning in either the first quarter of 2019 or January 2019, when applicable.9
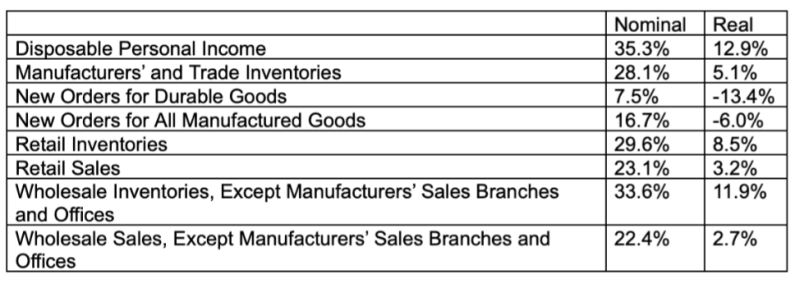
Note that not only are the inflation adjustments large, but they are highly variable, ranging from under 20% for wholesale sales to 22% to 23% for manufacturing inventories and new orders.
While 3% may seem like a small difference, in the context of GDP growth it represents nearly a $1 trillion difference in real output – roughly the GDP of Saudi Arabia. And in the context of annual economic growth, 3% over a 4-year period is a very large number – the difference between robust and anemic growth. Or between anemic growth and recession.
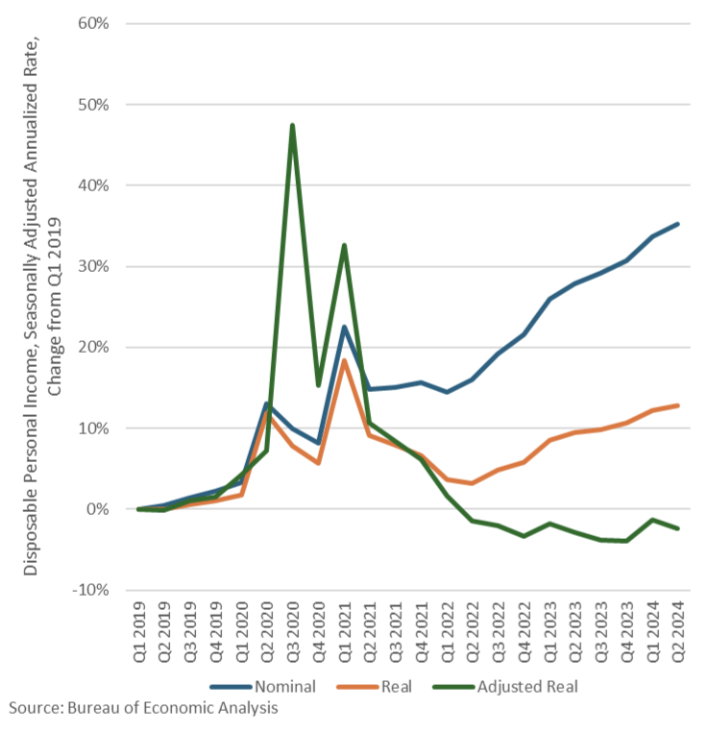
Implications for Incomes
Moreover, these are all official numbers. When disposable personal income is deflated with a more accurate inflation metric (detailed below), the real increase of 12.9 percent in disposable income from the first quarter of 2019 through the second quarter of 2024 becomes a real decrease of 2.3 percent over that period – an aggregate 15% difference.
The chart below illustrates how the rapid increase in disposable personal income in 2020 and 2021 has subsequently been paid for through inflation in the two-and-a-half years thereafter.
Adjustments to Inflation Indices
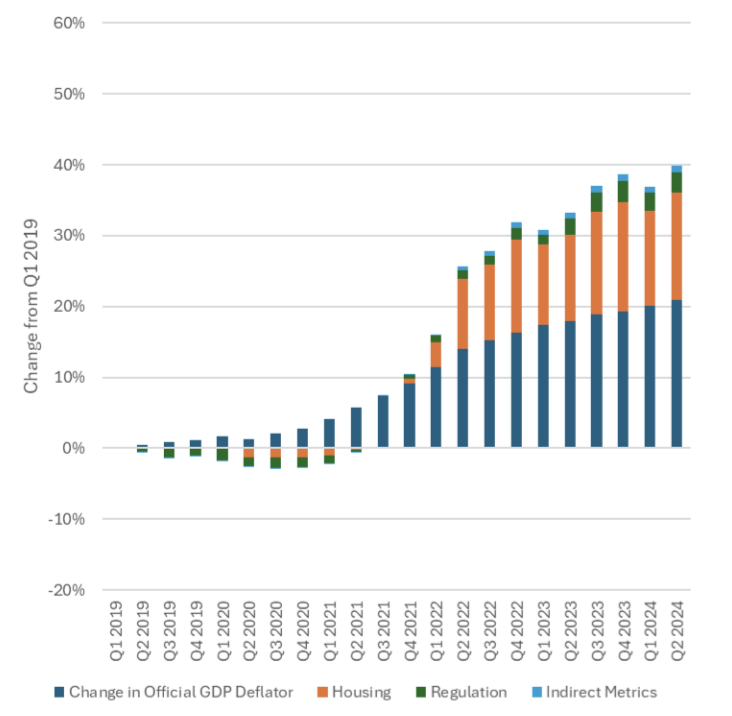
To produce an alternative inflation metric that more accurately reflects the rise in the cost of living, several alterations must be made to the typical price indices used in the national accounts. These changes can be broadly categorized into three groups: housing, regulatory burdens, and indirectly measured prices.
The housing component has had the largest impact in terms of adjusting for the true cost of living; in the second quarter of 2024, it increased the cumulative change in the GDP deflator by roughly 75 percent. This was due to the combination of not only higher home prices but also higher interest rates. That is, a mortgage payment is made of the amount borrowed and the interest rate, and if both house prices and interest rates are rising then the cost of home ownership rises on both fronts.
Conversely, using this accurate method the relatively low interest rates in 2019, 2020, and early 2021 actually have a negative impact on the GDP deflator. That is to say, the adjustment reduced inflation during those years.
Likewise, Trump-era deregulation led to marginal decreases in the cost of living which were not captured by official inflation metrics in 2019 and 2020, a trend which had fully reversed by the fourth quarter of 2022 under Biden-Harris.
Substituting indirect metrics for modified direct ones has a limited impact on the GDP deflator during the years in question. This is partly due to the inherent difficulties in measuring consumer expenditures like health insurance without double-counting (or double-weighting) other purchases, like medical care or medical care commodities.
The following data include the 2024 annual update of the National Economic Accounts published by the BEA in September 2024. Nominal GDP grew in each quarter of 2019 before contracting in the first half of 2020. Since then, nominal GDP has consistently expanded through the second quarter of 2024.
Summing the entire period, nominal GDP at a seasonally adjusted annualized rate in the second quarter of 2024 was 37.4 percent higher than the first quarter of 2019.
A significant portion of this increase, however, is merely inflation. The BEA’s inflation adjustment reduces growth over this period from 37.4 percent to 13.7 percent, or nearly two-thirds of nominal growth.
The BEA’s inflation adjustment suffers from the problems outlined previously. Utilizing a modified GDP deflator that includes more accurate metrics for housing, regulatory costs, and indirect costs yields a more accurate inflation measurement and therefore a more accurate valuation of real GDP.
While the BEA says that from the first quarter of 2019 through the second quarter of 2024 the GDP deflator rose 20.9 percent, the modified GDP deflator has risen 39.9 percent over that same period.
This yields an adjusted real GDP significantly below the official real GDP figure estimated by the BEA: Instead of a 13.7 percent increase, the adjusted real GDP shows a 2.5 percent decrease from the first quarter of 2019 through the second quarter of 2024.
In chained 2017 dollars, adjusted real GDP in the second quarter would be approximately $19,924 billion, about $3,300 billion below the official real GDP figure of $23,224 billion. For perspective, that is 1.5 times the GDP of Canada.
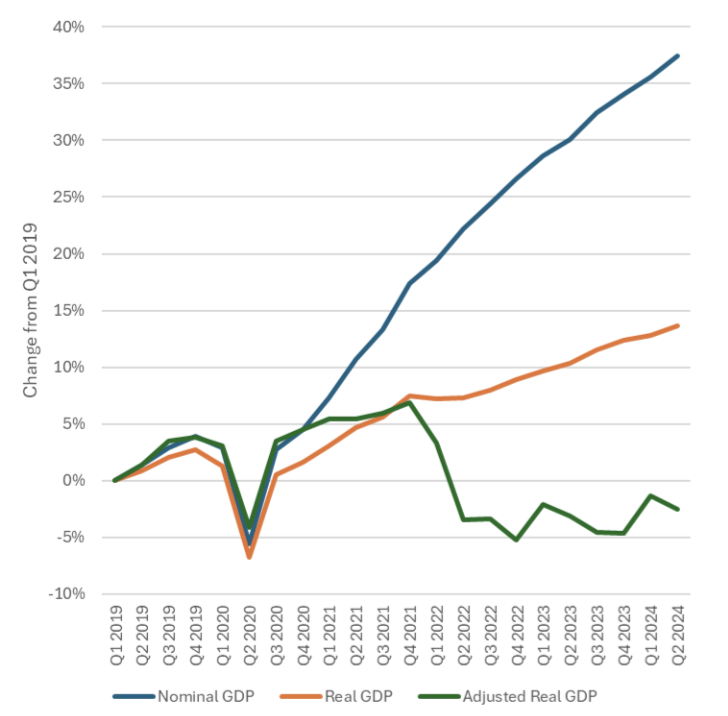
By the second half of 2021, cumulative real GDP and adjusted real GDP were nearly identical: In the third quarter of that year, they were 5.6 percent and 6.0 percent above their respective levels in the first quarter of 2019. In the fourth quarter of 2021, the increases were 7.5 percent and 6.9 percent, respectively.
With the rapid increase in prices during 2022, however, these metrics diverged sharply. Real GDP declined only slightly in the first quarter of 2022, but adjusted real GDP fell sharply, followed by a faster decline in the second quarter.
By the fourth quarter of that year, the decline relative to the first quarter of 2019 exceeded that seen during the government-imposed lockdowns in 2020. In the two years from the second quarter of 2022 through the second quarter of 2024, there has been nearly no economic growth according to this adjusted real GDP.
On a per capita basis, the results are worse because the population has increased approximately 2.1 percent from the first quarter of 2019 through the second quarter of 2024. During that period, nominal GDP per capita increased $22,182, or 34.7 percent. Real GDP increased $7,038 in chained 2017 dollars, or 11.4 percent. Adjusted real GDP fell $1,540, or 2.5 percent.
Even without considering population growth and per capita GDP, the adjusted real GDP values imply that the nation entered a recession in the first quarter of 2022 and remained in that contraction through the second quarter of 2024. In just three of those ten quarters did adjusted real GDP increase (with one being only a marginal increase) and none of the increases occurred in consecutive quarters.
Conclusion
According to our adjustments, cumulative inflation since 2019 has been understated by nearly half. This has resulted in cumulative growth being overstated by roughly 15%. This is a large amount for just 5 years – for perspective, peak-to-trough drop in real GDP during the 2008 crisis was 4%.
Moreover, these adjustments indicate that the American economy has actually been in recession since 2022.
These conclusions are in stark contrast to the establishment narrative that the US economy is enjoying robust growth that for some reason the public is incapable of perceiving.10 Indeed, our results are consistent with the perceptions of the American public, of whom a majority believe we are in recession.11
References
- “Inflation is Higher than the Numbers Say.” Casselman, B. (2020, September 2). The New York Times.
- “Trump Once Again Says Economic Data is Fake News.” Yahoo Finance, 2024.
- U.S. Bureau of Economic Analysis, Measuring the Economy: A Primer on GDP and the National Income and Product Accounts, December 2015. See also Methodologies, U.S. Bureau of Economic Analysis.
- U.S. Bureau of Labor Statistics, Measuring Price Change in the CPI: Rent and Rental Equivalence. See also Rental equivalence estimates of national and regional housing expenditures, Improved Measures of Housing Services for the U.S. Economic Accounts (May 2021), and the NIPA Handbook, U.S. Bureau of Economic Analysis, for information on owner-occupied rent expenditures.
- See Quality Adjustment in the CPI, Quality Adjustment in the Producer Price Index, and A Review of Hedonic Price Adjustment Techniques for Products Experiencing Rapid and Complex Quality Change, U.S. Bureau of Labor Statistics. See also The Role of Hedonic Methods in Measuring Real GDP in the United States, and the NIPA Handbook, U.S. Bureau of Economic Analysis. Additional examples of the need for and application of hedonic adjustments can be found in Methodology for Regional Price Parities, Real Personal Consumption Expenditure, and Real Personal Income, April 2023, and The Expanding Role of Hedonic Methods in the Official Statistics of the United States, June 2001, U.S. Bureau of Economic Analysis. See also Quality Adjustment at Scale: Hedonic vs. Exact Demand-Based Price Indices, June 2023 and revised October 2024, and Using Machine Learning to Construct Hedonic Price Indices, June 2023, National Bureau of Economic Research.
- For a more in-depth explanation on some of the ways in which regulators and government statisticians control for quality and price changes related to regulatory changes, see the Office of Management and Budget Circular No. A-4, issued on November 9, 2023, which superseded the circular of the same name issued on September 17, 2003. See also the December 2020 publication by the Council of Economic Advisors, Estimating the Value of Deregulating Automobile Manufacturing Using Market Prices for Emissions Credits, for an example where regulatory changes resulted in price and quality changes that were in fact reflected in the national accounts. The impacts of some large regulations are already reflected in inflation metrics while others are not.
- U.S. Bureau of Labor Statistics, Measuring Price Change in the CPI: Medical Care, Improvements to the CPI Health Insurance Index, BLS Handbook of Methods. See also Modernizing the Consumer Price Index for the 21st Century (2022), The National Academies of Sciences, Engineering, and Medicine, and the U.S. Department of Labor.
- U.S. Bureau of Economic Analysis.
- Personal Income and Outlays, U.S. Bureau of Economic Analysis. Consumer Price Index; Producer Price Index; U.S. Bureau of Labor Statistics. Advance Monthly and Monthly Retail Trade Surveys and Quarterly E-Commerce Report; Manufacturers’ Shipments, Inventories, & Orders (M3) survey; Monthly Wholesale Trade report; U.S. Census Bureau.
- Scanlon, Kyla. “Why People Feel Rotten About The Economy.” Current Affairs, August 8, 2024, www.currentaffairs.org/2024/08/why-people-feel-rotten-about-the-economy.
- Peck, Emily. “More than half of Americans think the U.S. is in a recession, polls show.” Axios, 23 May 2024, www.axios.com/2024/05/23/us-recession-economic-data-poll.
EJ Antoni is a Research Fellow in The Heritage Foundation’s Grover M. Hermann Center for the Federal Budget. His MA and PhD in economics are from Northern Illinois University.
Peter St. Onge is former assistant professor at Feng Chia University and an independent consultant. His MA and PhD in economics are from George Mason University.
Join the conversation:
Published under a Creative Commons Attribution 4.0 International License
For reprints, please set the canonical link back to the original Brownstone Institute Article and Author.