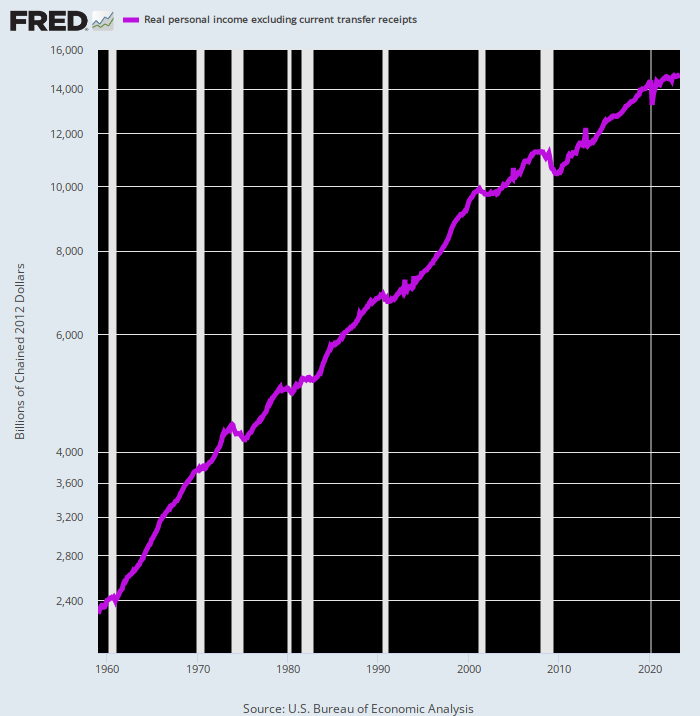
Here is a large caliber smoking gun. The BEA series for real personal income less transfer payments is a pretty serviceable proxy for private market output before the impact of Washington stimmies and distortions caused by transfer payments and government borrowing. After all, earned income – wages, salaries, bonuses, profits, interest and dividends – is the payment to factors of production for output and therefore its reciprocal.
The long-term trend is slouching definitively southward. Since the pre-lockdown peak in February 2020, in fact, the growth rate has slowed to just 17 percent 0f its pre-2000 average.
Per Annum Growth of Real Personal Income Less Transfer Payments:
- Feb. 1960 to Feb 2000: +3.62 percent;
- Feb. 2000 to Feb. 2020: +2.08 percent;
- Feb. 2020 to May 2023: +0.61 percent.

It doesn’t take a lot of cogitation to explain this dismal trend. The US economy is freighted down with debt and it is also short of labor, riddled with non-productive speculation and financial engineering and starved for productive investment. Taken together, those malign forces were more than enough to slow the underlying growth of the US economy to a crawl.
To be sure, the government reports slightly higher real GDP growth than the tepid 0.61 percent figure displayed above. During the equivalent 3.25 year period between Q4 2019 and Q1 2023, in fact, the per annum growth of real GDP posted at 1.61 percent. That’s still nothing to write home about, but it is considerably better than the pittance of gain private producers have produced and earned since the pre-Covid peak.
The difference, of course, is owing to the wonders of GDP accounting. That is, huge transfer payments from producers to non-producers and massive Federal spending and borrowing and its monetization at the Fed’s printing presses do give rise to additional GDP in an accounting sense and for the time being.
Alas, heavily taxing producers today and threatening even more future taxation to service the ballooning public debt isn’t a source of sustainable growth. It simply steals economic resources from the future.
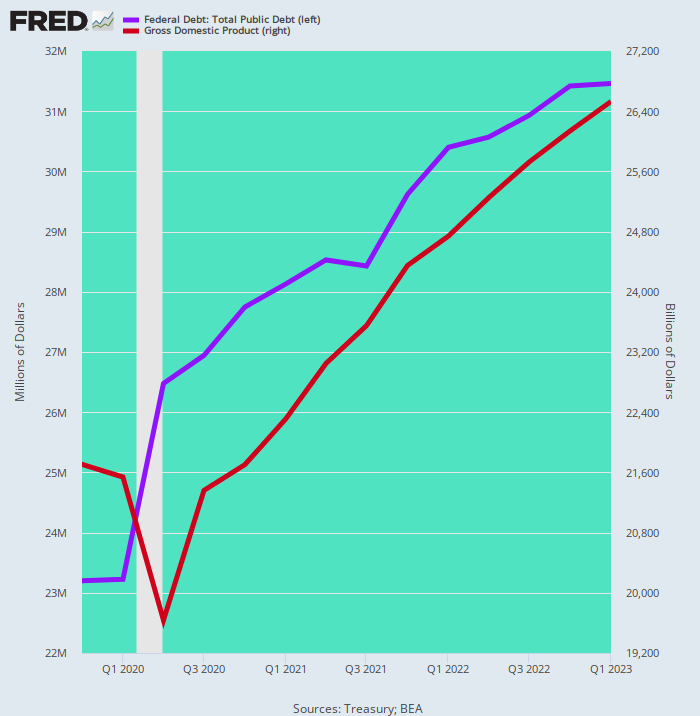
For avoidance of doubt, consider the chart below. It shows that between Q4 2019 and Q1 2023 the public debt (blue line) increased by $8.26 trillion—a figure equal to 1.70X the $4.82 trillion gain in nominal GDP (brown line).
Needless to say, you don’t need a slide rule or even an abacus to project where that would lead. After just 12 years at these rates of growth the public debt would be $100 billion compared to just $52 billion of GDP—even as debt service exploded.
Indeed, we can’t see how the weighted average cost of debt could be held to even 6 percent under a scenario in which the Fed’s printing presses remain on idle because the inflationary cat is now out of the bag. That is to say, at the rate of public debt growth during the past 3.25 years, interest on the public debt would likely reach $6 trillion per annum over the next decade or so—a figure roughly equal to the total level of current Federal outlays.
In short, long before 12 years had elapsed, the system would go tilt. Even the tepid growth of real GDP recorded since the 4th quarter of 2019 cannot possibly support a Federal debt that is literally exploding higher at a compounding rate of gain.
Change In Public Debt Versus GDP, Q4 2019 to Q1 2023

Undoubtedly, the usual suspects or apologists for Washington’s fiscal disaster will counsel not to worry—the Fed will print the money, if need be.
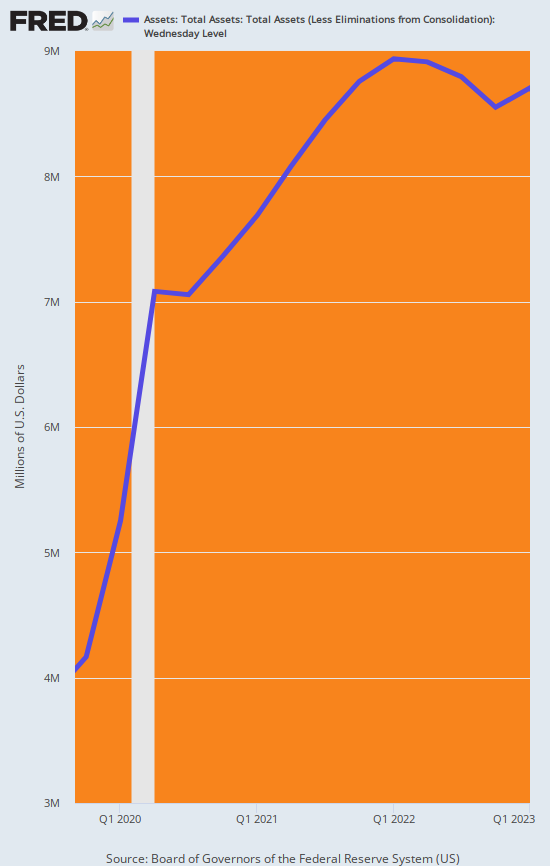
We’d say not so fast. The Fed has printed its way into a hellacious corner. During the same 3.25 year period in which the public debt exploded by $8.26 trillion, the Fed’s balance sheet soared by $4.45 trillion. That means more than 55 percent of those massive gains in the public debt were monetized by the central bank.
Needless to say, the Fed is now, finally, on a balance sheet shrinkage campaign—$95 billion per month—that still has miles and miles to go. Despite Wall Street’s desperate hopes, there simply won’t be a Pivot to money printing for years to come, even as the US economy sinks into a prolonged stagflation.
And that means, in turn, that the $2-$3 trillion annual deficits now baked into the cake through the end of this decade will perforce need to be financed in the bond pits, not at the printing press. Accordingly, the weighted average yield on the Federal debt is heading relentlessly higher because the law of supply and demand has not been repealed.
Balance Sheet Of The Federal Reserve, Q4 2019 to Q1 2023

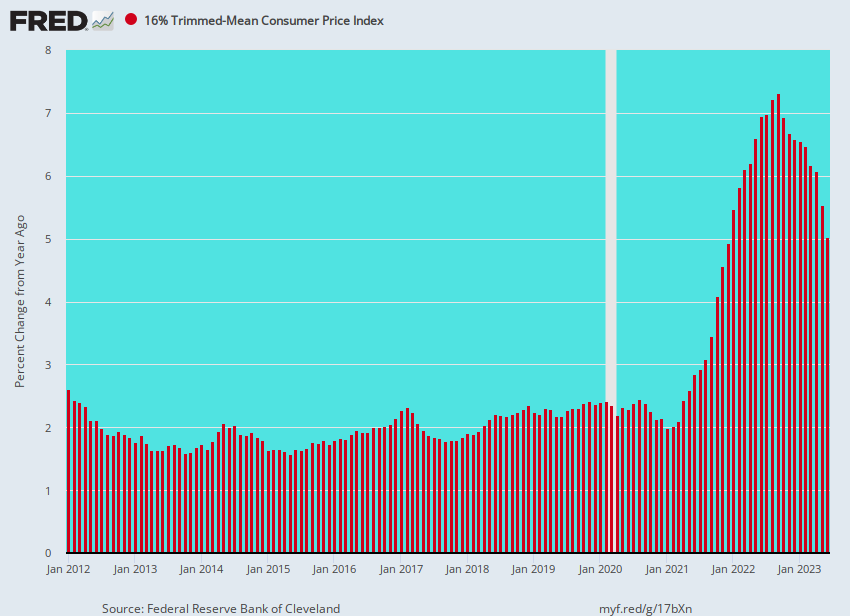
For want of doubt, here is the current run rate of the true inflation core as measured by the 16 percent trimmed mean CPI. Inflation is still running at 5 percent, meaning that the Fed will be in no position to resume its bond buying campaign anytime soon.
Y/Y Change In 16% Trimmed Mean CPI, 2012 to 2023

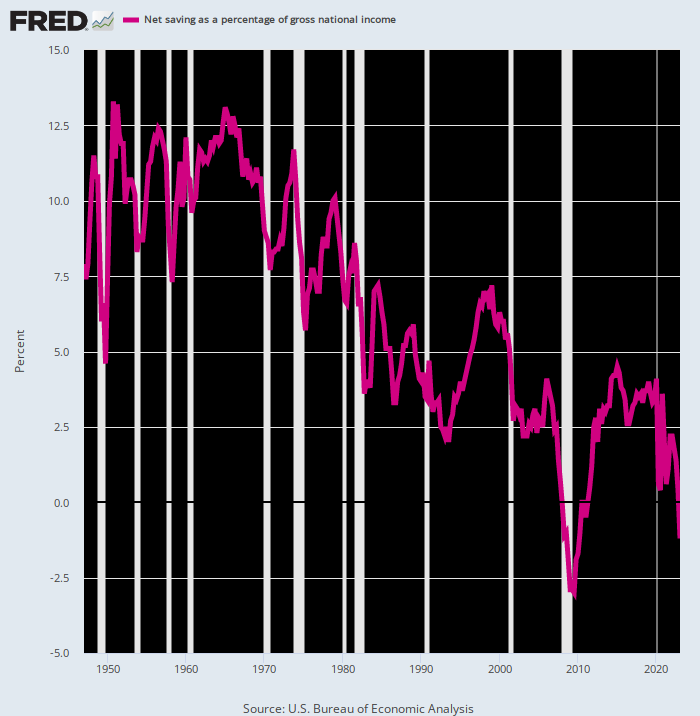
Then again, if the estimated $25 trillion of new government deficits over the coming decade are not financed at the central bank printing press, they will need to be absorbed out of the private savings pool.
We’d say good luck with that. Household and corporate savings have withered and government entities have already absorbed what’s left. The only way to clear the markets, therefore, is via soaring yields and crowding out of private investment, and with a vengeance at that.
Net National Savings As A Percent Of National Income, 1948 to 2023

Reposted from the author’s private service
Join the conversation:


Published under a Creative Commons Attribution 4.0 International License
For reprints, please set the canonical link back to the original Brownstone Institute Article and Author.


