Well, that left nothing to the imagination. The August CPI report, in fact, buried the idea that inflation is abating and that new “juice” from the Fed is just around the corner.
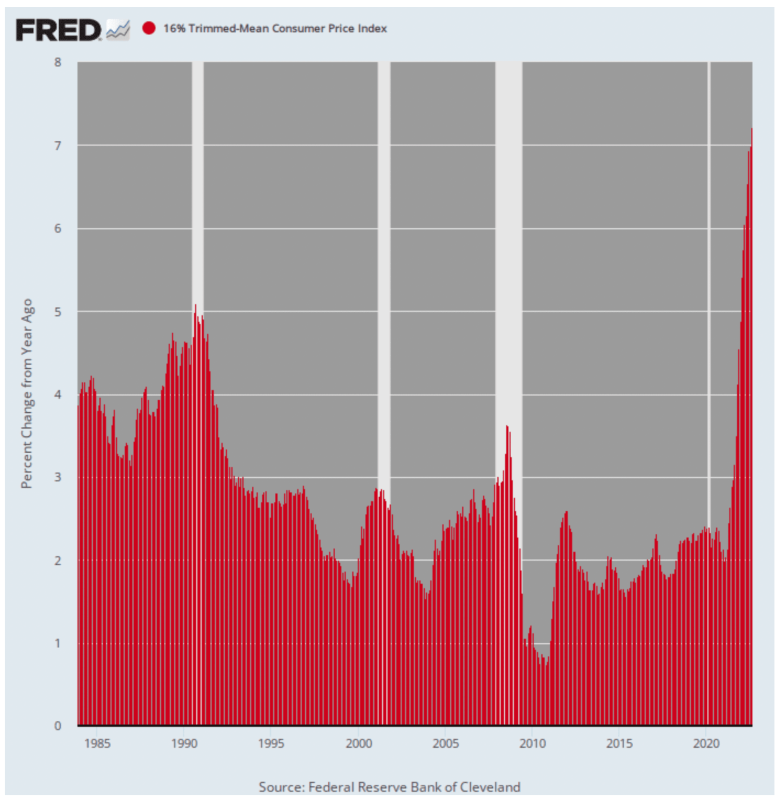
Again, the trusty 16% trimmed mean CPI, which removes short-term fluctuations from the trend, made it abundantly clear that inflation has a strong head of steam. The Y/Y number was up by a record +7.2%.
That’s more than double the 3.2% reading of August 2021, and by far the highest print since the series was established in 1985.
Y/Y Change In 16% Trimmed Mean CPI, 1985-2022
To be sure, the August inflation report would have been even worse, save for the sharp drop of gasoline prices since June. But even then, the energy price abatement story was not all it was cracked up to be.
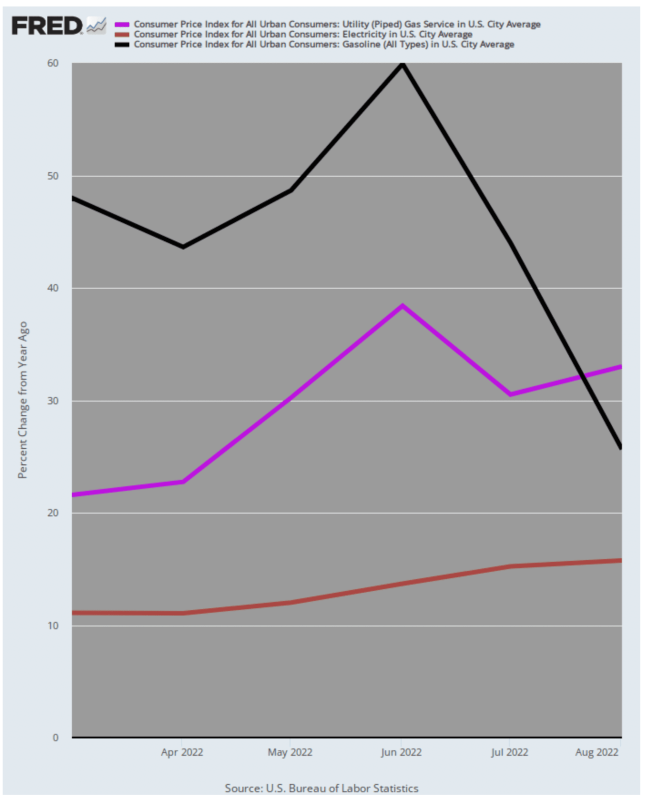
That is, gasoline prices rose by a “mere” 26% Y/Y in August compared to a sizzling peak gain of 60% in June. However, the Y/Y increases in electric utility prices and pipeline gas for home heating continued to climb higher:
- Electric utilities (brown line) was up 15.8% in August compared to 11.1% in March;
- Pipeline gas prices (purple line) were up 33.0% in August compared to 21.6% in March.
In a word, there is still plenty of energy inflation momentum in the CPI, even if pump prices for gasoline have taken a relative breather. But even there, the 26% gain Y/Y is not exactly deflationary when it comes to family budgets.
Y/Y Change in Gasoline Prices Vs. Pipeline Nat Gas And Electric Utilities, March 2022 to August 2022
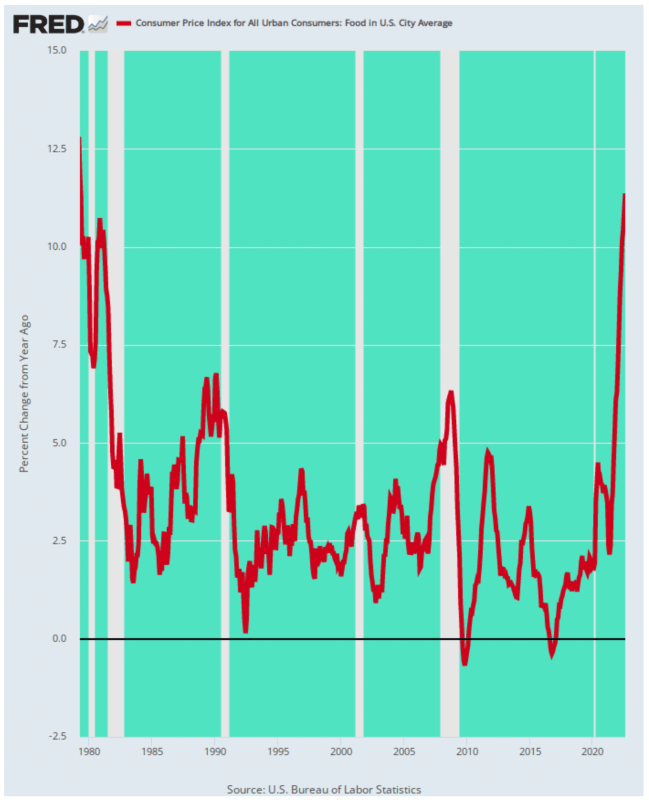
It might also be noted that food has more than double the weight in the CPI versus gasoline (13.5% vs, 4.9%), and food inflation showed no sign of abatement in August.
In fact, the August Y/Y gain of 11.4% was more than triple the year ago gain (3.7%) and the highest increase in 43 years. You have to go back to the roaring commodity markets of 1979 to find an equivalent slam on household food budgets.
Y/Y Change In CPI For Food, 1979-2022
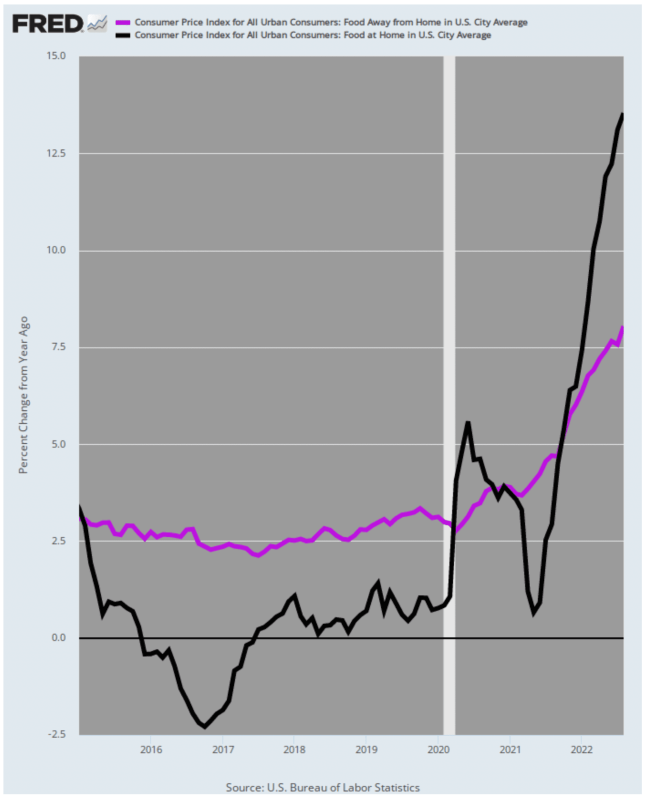
Moreover, when you look under the hood, it is evident that food inflation still has more upward momentum. That’s because the sub-index for food-away-from-home (aka restaurants) came in at just 8.0% in August versus a red hot 13.6% gain in grocery store prices (food at home).
Needless to say, restaurant menu prices will soon catch up with underlying food costs as represented by the black line for food at home; and on top of that lies the further cost pressure of rapidly rising restaurant wages.
Y/Y Increase in Food-Away-From-Home Vs. Food At Home, 2015-2022
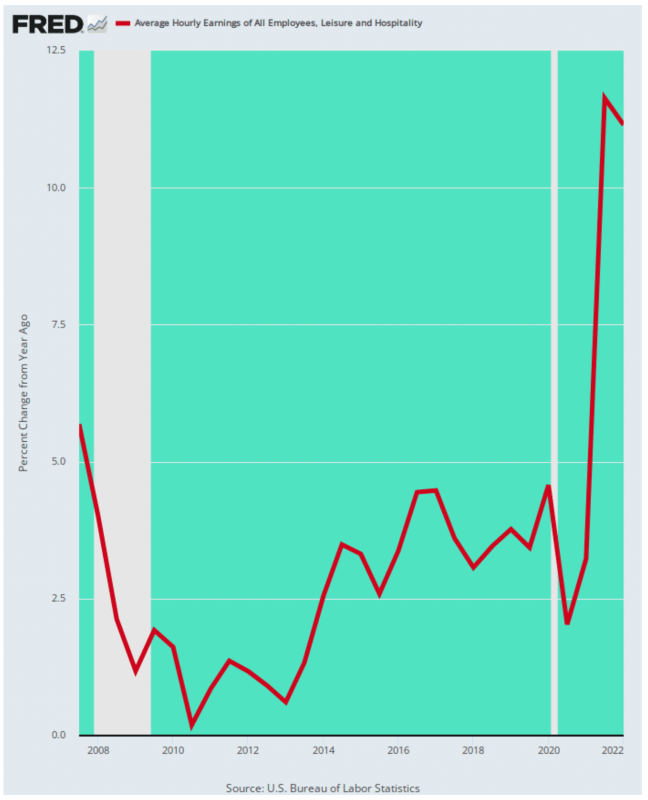
In fact, wage cost pressures in the hotel, restaurant and related services industries have been ferocious, rising at double-digit rates, and are now at levels far above anything recorded during the last 15 years. Eventually, those costs will pass through into menu prices and room rates, or there will be sweeping economic carnage in the Leisure & Hospitality sector.
Y/Y Change In Average Hourly Earnings for Leisure & Hospitality Workers, 2007-2022
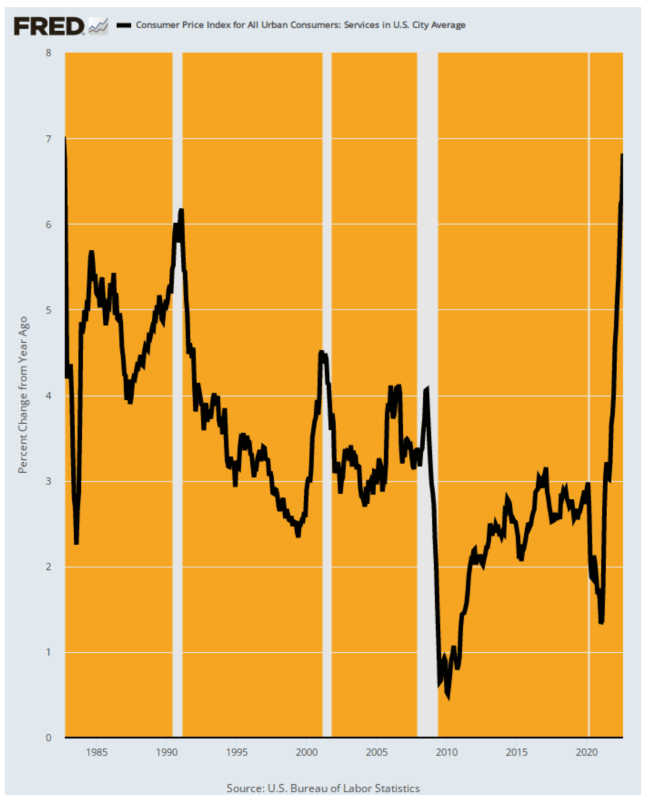
Nor are restaurants, bars and hotels the only service sectors showing accelerating inflation. For services as a whole (which account for 61% of the CPI), the August Y/Y gain was 6.8%, marking the highest level since September 1982.
Needless to say, the right-hand portion of the chart below gives no indication that the main drivers of the CPI—domestic services—are about to roll over anytime soon. Last August, in fact, the services CPI was running at just 3.0% on a Y/Y basis, which accelerated to 4.6% by January and is now pushing 7.0%.
Y/Y Change In CPI for Services, 1982-2022
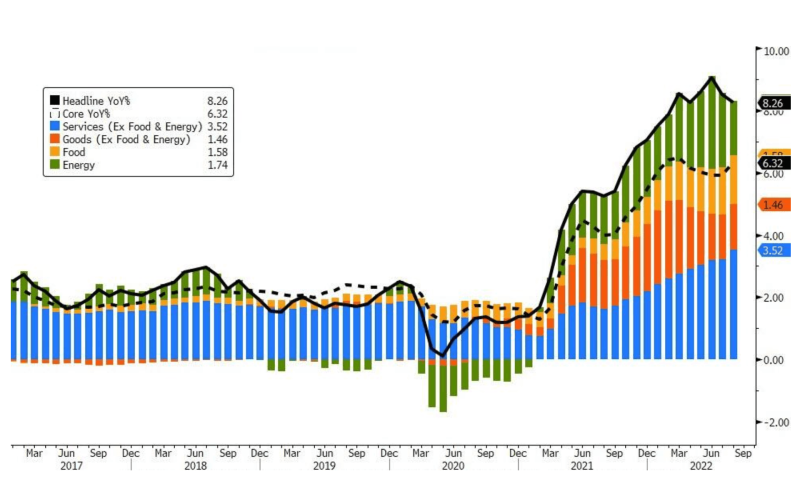
Indeed, when viewed as a contribution to the top-line CPI change, the accelerating level of services inflation is clearly evident. The share of the total CPI gain attributable to services prices has now been accelerating for months as shown in the blue bars below.
Share of Contribution to the CPI Topline by Product Group, 2017-2022
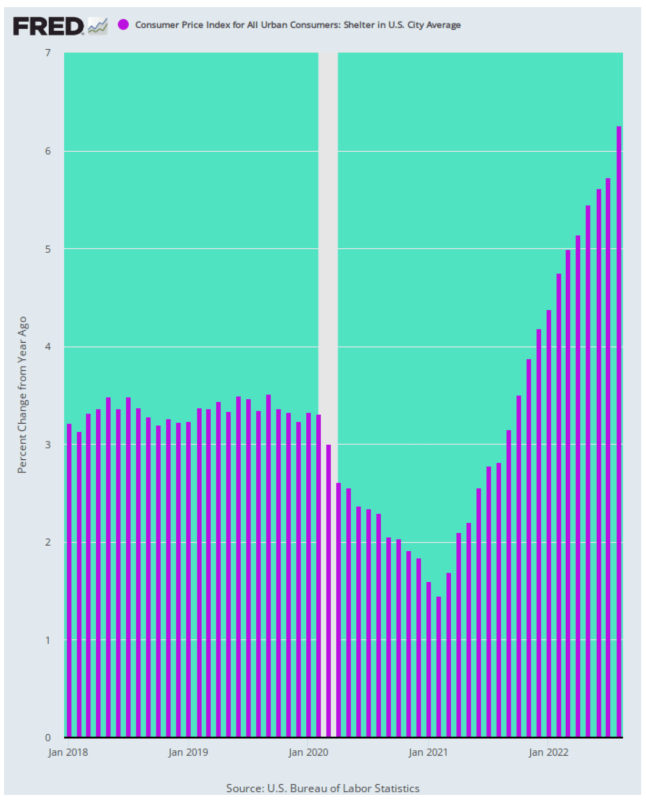
Finally, the August CPI once again reminded of the contribution of shelter and rent inflation to the inflationary momentum now underway. That sub-index was up by 6.3% in August—more than double its pre-Covid trend–and actually accelerated from prior months.
Y/Y Change for CPI for Shelter, 2018-2022
So to the dip-buyers, we say be our guest. Just keep clinging to the vestiges of the belief that inflation will soon be conquered, a bad recession avoided and so the Fed is freed to pause, then ease.
But the fact is, Tuesday’s CPI report destroyed the idea that the Fed will pause soon. In fact, excluding volatile food and energy prices, the so-called core CPI rose 0.6%, which if sustained would be an annual rate above 7%.
That’s higher than any time from 1991 to the pandemic; and it’s also what the paint-by-the numbers folks at the Eccles Building watch like a hawk.
Republished from DavidStockmansCorner
Join the conversation:
Published under a Creative Commons Attribution 4.0 International License
For reprints, please set the canonical link back to the original Brownstone Institute Article and Author.