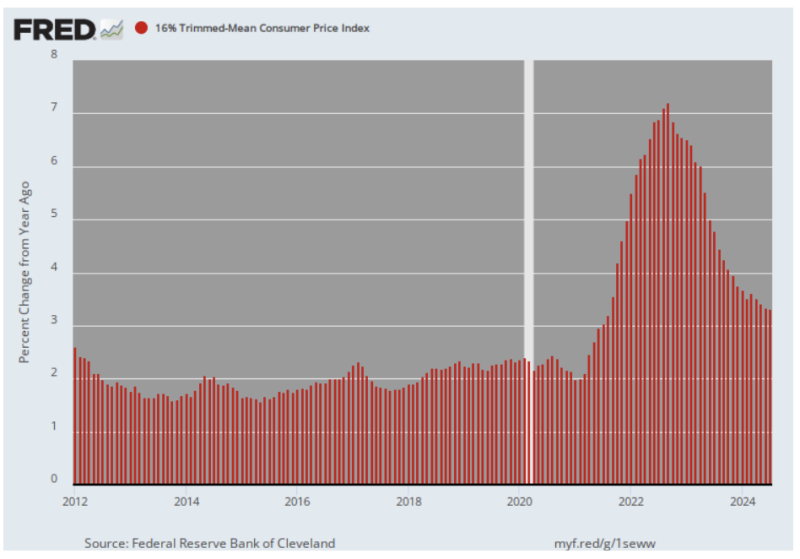
Here is the result of the Fed’s misbegotten pro-inflation policy since it officially adopted its 2.00% target in January 2012. According to our trusty 16% trimmed mean CPI, the price level is up by +41% since then, and was still rising at a 3.31% annual rate in July, as per this week’s CPI release.
Accordingly, given that any dollar earned or saved in 2012 is worth just 70 cents today, the question recurs: Why in the world should the Fed even be thinking of opening up the money spigot and thereby exposing wage earners and savers to a further prolongation of the purchasing power theft evident in the graph below?
And that’s to say nothing of another flareup like the recent one, which at its 7% peak was depreciating the dollar’s purchasing power by 50% every nine years.
There is only one real reason for a new round of rate cuts, which is now virtually guaranteed to commence next month. To wit, Wall Street has repeatedly threatened to stage a hissy fit if the Fed doesn’t soon pleasure traders and speculators with a renewed dose of cheap carry trade credit and even higher PE multiples than the extreme valuations already embedded in the stock market.
Of course, the Fed heads would not openly admit to something this craven. So its Wall Street patsies beat the tom-toms for rate cuts, claiming that they are for the benefit of the average household and are necessary to prevent the Main Street economy from tipping over into the scourge of recession or worse.
But with the US economy now burdened with nearly $100 trillion of public and private debt, how in the world could lower interest rates be even remotely appropriate? After all, a central bank-induced reduction in interest rates is designed to cause households, businesses, and government to pile even more debt on top of their already tottering debt-entombed balance sheets.
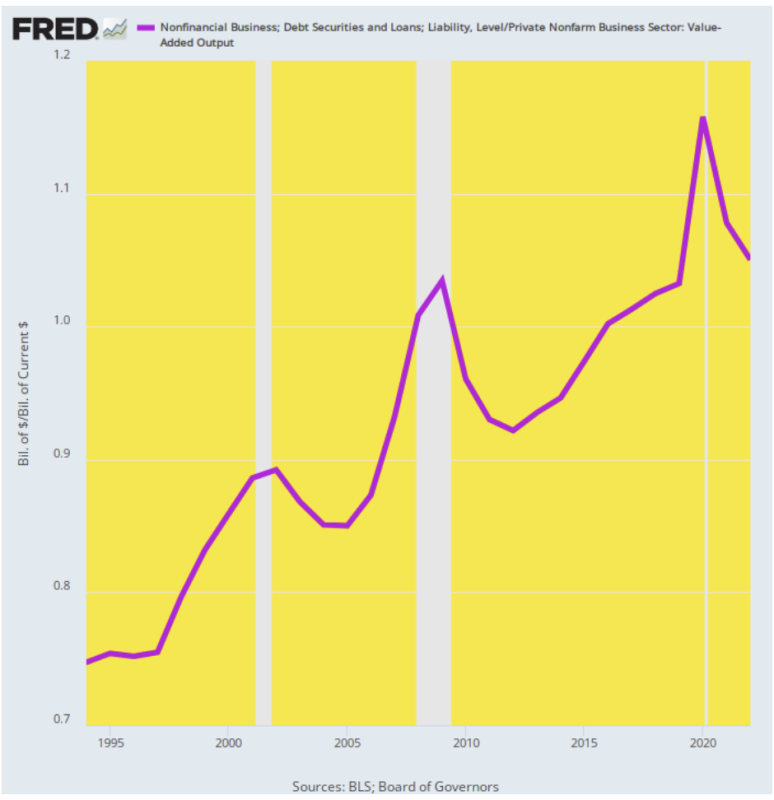
Consider the non-financial business sector’s leverage increase just since 1994. At the former date, when Greenspan’s wealth effects doctrine was just being launched, nonfinancial business debt was equal to 75% of the sector’s value-added output. Yet today that ratio stands far higher at 105%.
Self-evidently, this large rise in the leverage ratio has not funded the procurement of productive assets at a higher rate. In fact, the overwhelming share of the added business sector leverage has gone into stock buybacks, overvalued M&A deals, and other Wall Street-enriching financial engineering schemes.
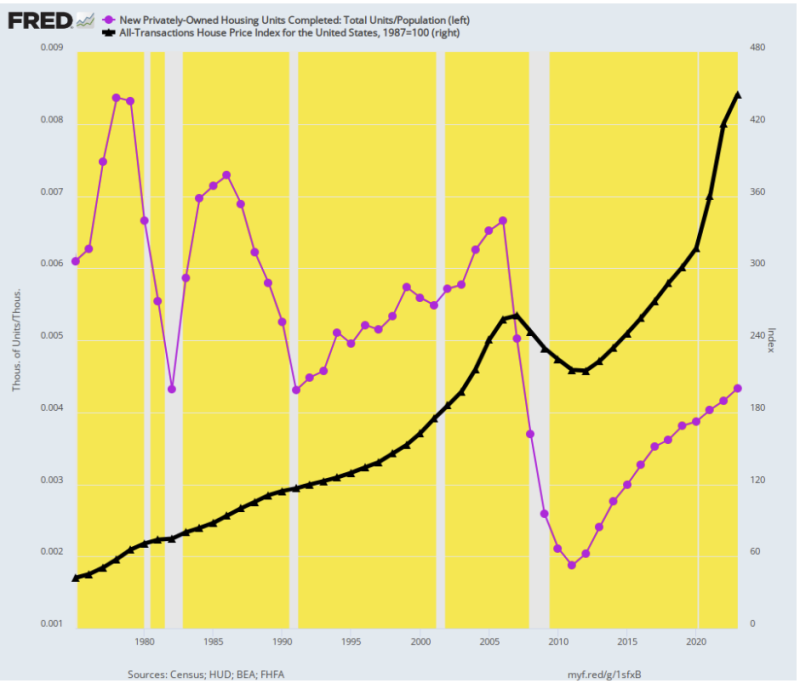
The same is true with respect to the purported benefits to the housing construction sector. The housing unit completion level per capita (purple line) in 2023—even after the Fed’s pandemic money-printing spree—was still 37% lower than it had been in 1987.
By contrast, the index of housing prices (black line) is up by a staggering 345% during the same 36-year period. Again, lower interest rates do far more to spur existing asset prices than real output, jobs, and income.
What has happened after 37 years of central bank financial repression, cheap falsified debt costs, and recurrent Fed coddling and price-keeping bailouts in the stock market, therefore, is that Wall Street has been transformed into an all-out gambling casino. With tens of trillions of market cap at stake, utterly bogus fairy tales about the Fed’s purported stimulative benefactions to Main Street abound.
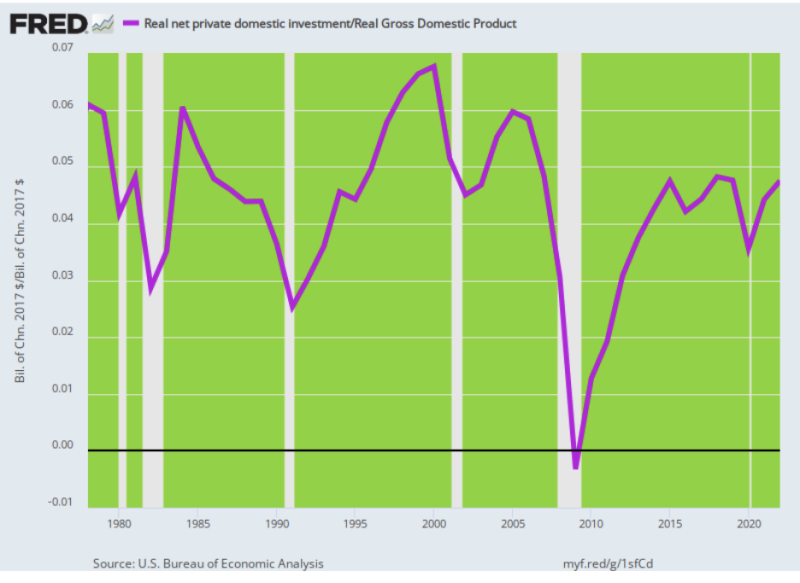
Yet at this late juncture with nearly $100 trillion of total debt representing a record 360% of GDP there should literally be no voices at all for lower interest rates and even more debt. After all, the whole rationale for the latter is the stimulation of higher levels of investment in the residential and business sectors of the Main Street economy.
But on that score, there is no cigar now—nor has there been one save for the unsustainable and short-lived tech stock boom of the late 1990s. Indeed, this is so apparent to the lying eyes of any observer per the chart below that only one conclusion is possible. Namely, Wall Street speculators have so corrupted and dominated the financial market narrative that like the Queen in Alice in Wonderland, our central bankers now apparently believe six impossible things before breakfast or at least before the cash market opens at 9:30 AM.
As for the household sector, the very idea that consumers need more debt is ludicrous. During the heyday of Main Street prosperity in the 1950s, the household debt-to-GDP ratio stood at just 28%. Since 1971 and especially 1987, however, it has been climbing steadily skyward. Thus, after nearly quadrupling to a peak of 97% in 2008, it still stood at 71% as of 2023.
The runup of household mortgage, credit card, auto, and other debt, in turn, caused the PCE (personal consumption expenditure) share of GDP to march higher in near lockstep. Compared to its 58.1% share of GDP in 1953, PCE clocked in at 69.2% of GDP at the recent peak in 2022.
Self-evidently, even a semblance of familiarity with economic history and the logic of investment and growth would tell you that when it comes to the relentlessly rising PCE claim on GDP, no mas!
For crying out loud. The central banking arm of the state should be neutral as between borrowers and savers, but when it comes to the household sector the Fed has literally savaged savers for several decades now.
In short, what is desperately wanting is higher savings and investment rates, meaning that another round of cheap debt to household borrowers and a renewal of punitive interest rates on bank account savings is the very last thing that should be on the table.
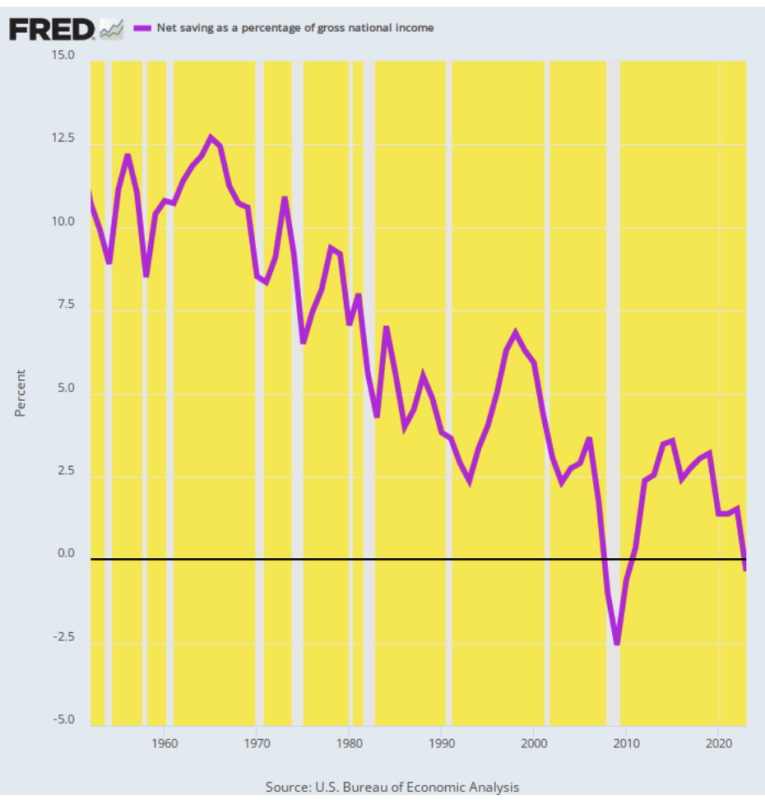
As it is, the chart below reflects how the Fed has generated the worst of both worlds. On the one hand, it has driven household savings rates and business sector savings (i.e. retained earnings) to rock-bottom levels, while, on the other hand government dis-saving (i.e. borrowing) has climbed relentlessly skyward.
Of course, the net of the two is what’s left for investment in productivity and growth over and beyond reinvestment of current period allowances for consumption of the capital stock (i.e. depreciation and amortization). As is starkly evident on the graph below, what’s left currently is not net at all—a drastic fall from the 7% to 12% of GDP net savings rates that prevailed during the heyday of Main Street prosperity.
So again, tepid progress in reducing the rate of CPI is basically irrelevant. Lower interest rates will not spur more investment and will most surely exacerbate the private savings and investment shortfall that plagues the Main Street economy.
Notwithstanding the deleterious impact of rate cuts and sub-economic debt yields on long-term investment trends per the charts above, the Wall Street mantra still claims that rate cuts are now necessary to prevent the economy from tipping over into recession. But even this claim amounts to a Hail Mary that is not supported by the evidence.
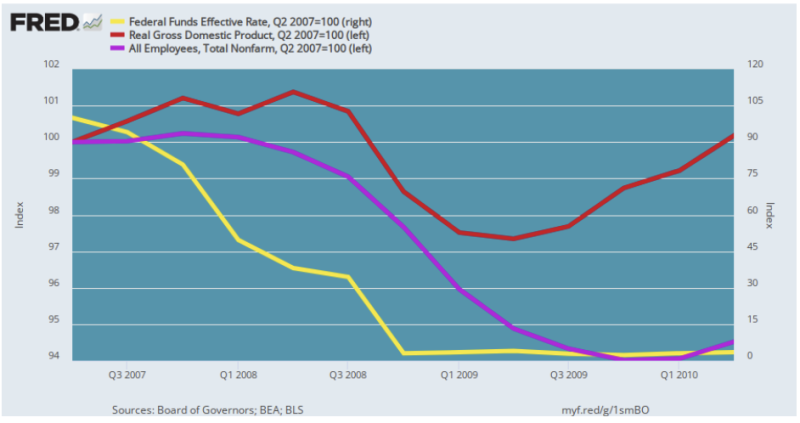
Here is what happened during the Great Recession period. The Fed started cutting the then 5.25% Federal funds rate (yellow line) in the third quarter of 2007 and by a year later in Q4 2008 had it essentially down to 10 basis points. That amounted to a 98% reduction and the most radical and rapid rate cut sequence in the Fed’s entire history. By a long shot.
In fact, however, by 2008 the US economy was so saturated with distortions, imbalances, and excess debt that a recessionary purge and rebalancing was unavoidable. So after drifting slightly higher for the next three quarters, real GDP (red line) finally rolled over in Q3 2008 and did not hit bottom until Q2 2009. Even then, after two years of the most radical interest rate cuts ever enacted, real GDP was still below its Q2 2007 by the end of March 2010.
In the case of nonfarm employment (purple line), the impact of rate cuts was even more tepid and delayed. The job count fell drastically, nearly in lockstep with the plunging Federal funds rate through Q3 2009. Yet after 18 months of ZIRP the nonfarm payroll count was still 6% below its June 2007 level.
In short, in the context of today’s debt-impaled US economy rate cuts are not what they are cracked up to be. Even as they ignite a roaring surge in the stock market casino, they hardly break the contraction in the Main Street economy at all.
That is to say, the Fed may well be the Wall Street speculators’ best friend, but it’s a yo-yo machine that repeatedly sets up the Main Street economy for a recessionary fall, and then does precious little to avert the contraction—even as it buries households, businesses, and governments alike ever deeper in unsupportable debt.
At the end of the day, the current renewed Wall Street drive for another round of substantial interest rate cuts puts us in mind of the famous Saturday Night Live skit in which a purportedly legendary music producer kept interrupting a recording studio session demanding that the band provide “more cowbell.”
That’s Wall Street’s relentless mantra today. It’s got the greed fevers and is yelling loudly: More cuts! More cuts!
Yet that is sure to make the economic music even more cacophonous.
Reposted with permission from David Stockman’s Corner.
Join the conversation:
Published under a Creative Commons Attribution 4.0 International License
For reprints, please set the canonical link back to the original Brownstone Institute Article and Author.