The 10-year UST yield has crossed the 3% mark. So you’d think this was a sign that a modicum of rationality is returning to the bond bits.
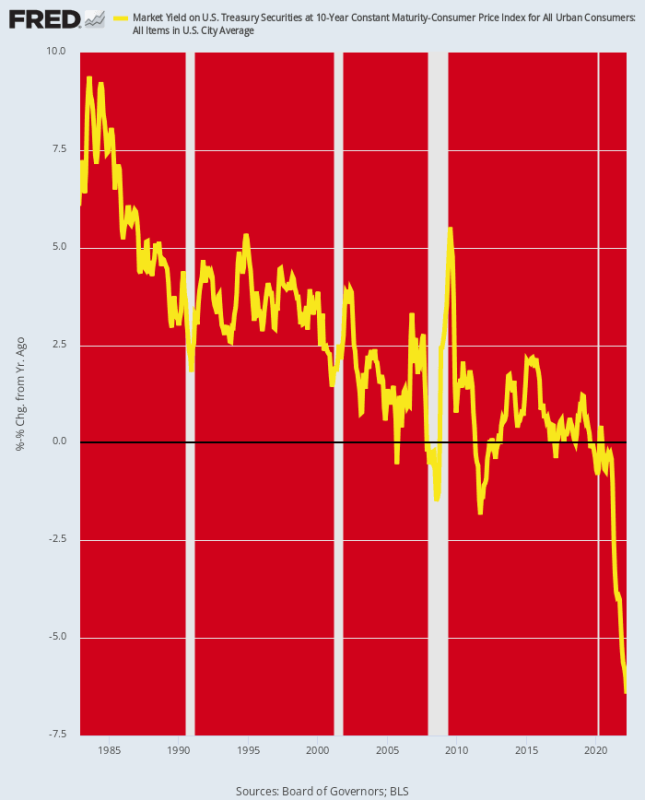
But not really. That’s because inflation is rising even faster than interest rates, meaning that real yields on the fulcrum security for the entire financial system are still dropping ever deeper into negative territory. Thus, at the end of March the inflation-adjusted (Y/Y CPI) rate dropped to -6.4% and even with the rise of nominal yields since then it still stands close to -6%.
Here’s the thing, however. For the past 40-years the Fed had been driving real yields steadily lower, although even during the money-printing palooza of 2009-2019, the real yield entered negative territory only episodically and marginally.
But after the Fed pulled out all the stops in March 2020 and commenced buying $120 billion per month of government debt, the bottom dropped out in the bond pits. Real yields plunged to territory never before visited, meaning that unless inflation suddenly and drastically plunges, the Fed is still massively behind the curve.
The fact is, there is no chance of staunching inflation if real yields remain mired deep in negative territory. Yet if the nominal yield on the UST should rise to 5-7%, and thereby marginally enter positive real yield territory, there would be carnage on Wall Street like never before.
Inflation-Adjusted Yield On 10-Year UST, 1982-2022
Among the many sectors that would be battered is nonfinancial business. Total debt in that sector now stands at $18.54 trillion. That’s up 83% from the already burdensome level of $10.14 trillion outstanding on the eve of the financial crisis in Q4 2007 and is 6X higher than the $3.1 trillion level which prevailed when Alan Greenspan took the helm at the Fed in mid-1987.
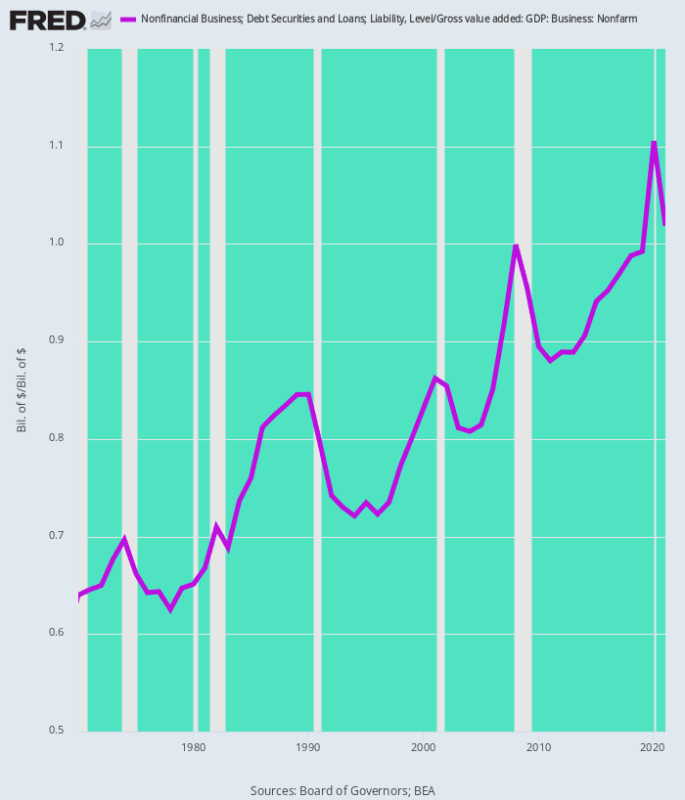
More importantly, the debt burden relative to gross value-added of the nonfarm business sector has climbed relentlessly higher for the past five decades. That is to say, American business has levered-up big time.
Nonfarm Business Debt As % Of Gross Business Value Added:
- 1970:64%;
- 1987: 82%;
- 2000: 83%;
- 2007: 92%;
- 2019: 99%;
- 2021: 102%.
In a word, the business sector (corporate and noncorporate combined) is leveraged like never before. Accordingly, when interest rates on term debt double and triple during the Fed’s impending struggle with inflation the impact on profits, cash flows and investment will be powerfully negative.
Nonfinancial Business Leverage: Debt Versus Gross Value Added, 1970-1921
Nor should the possibility of interest rate increases of these huge magnitudes be discounted. That’s because per the Fed’s confirmation today, we are entering a totally new policy regime. Within a few months, the Fed will be dumping $95 billion of supply per month into the bond pits—-virtually the opposite of the $120 billion per month supply removal that had prevailed after March 2020.
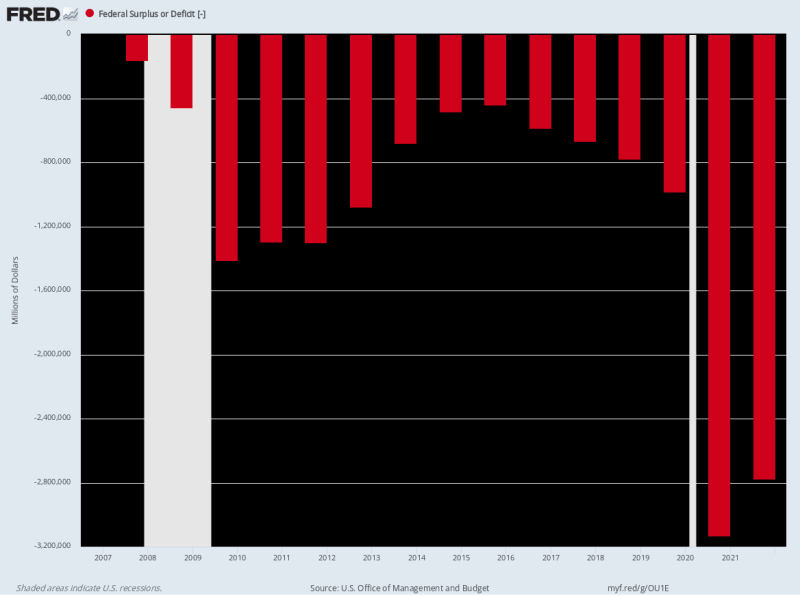
At the same time, Federal borrowing requirements will remain massive because the structural deficit has become deeply embedded in policy. Even after the $3.1 trillion and $2.8 trillion back-to-back deficits in FY2020-2021, the red ink is barely abating as Covid spending rolls off.
Thus, for the LTM period ending in March the Federal deficit totaled $1.6 trillion and we see no sign that it’s going lower any time soon.
In fact, the US Treasury is in a virulent catch-22 when it comes to impending borrowing requirements. That’s because debt service costs will be far higher as interest rates rise, while revenue growth will slowly sharply from current levels as the Fed’s pivot to aggressive tightening grinds the economy to a halt and then into recession.
For instance, OMB’s current net interest expense projection for FY 2022 totals $415 billion, which represents an implied yield of just 1.75% on the average of $23.9 trillion publicly-held debt outstanding during the the fiscal year. But as the Treasury debt rolls over—especially T-bills and 2-year notes—the average carry cost of the public debt will rise sharply.
By FY 2024 that rise could easily be 200 basis points, meaning a weighted average debt service cost of 3.75% on $26 trillion of projected publicly-held debt. In turn, that implies $975 billion of annual net interest expense or more than double the current fiscal year estimate.
Likewise, OMB projects revenue growth of 4.6% next year (FY 2023) and an outlay decline of -1.0%. But we’ll take the unders on both—especially the risible notion that spending will actually decline during the run-up to the most fraught presidential election of modern times.
In short, Uncle Sam is likely to be hitting the bond pits with at least $2 trillion per year in new debt paper in the period ahead, even as the Fed dumps in another $1.2 trillion at annualized rates, as it ramps down its balance sheet per today’s announcement.
What that adds up to is the return of the bond vigilantes—a revival of the old “crowding-out” syndrome as the bond pits struggle to fund $3.2 trillion of government debt paper per annum with no helping hand from the Fed’s printing press. In that context, of course, it will be business and home mortgage borrowers who will get the short-end of the stick.
Of course, the permabulls who were unaccountably out buying equities hand-over-fist after the Fed’s announcement are busy making up new delusions to convince themselves of the impossible. That is, that the Fed will engineer a “soft landing.”
Not in a month of Sundays, we’d say!
That’s because a paltry 75 basis point Fed funds rate now, and 225 basis points by year-end, is not going to throttle headline inflation that is pushing 9.0%. And most especially when demand is cooling only slowly, while a whole lot of inflationary pressure is still building in the commodities, PPI and services pipelines.
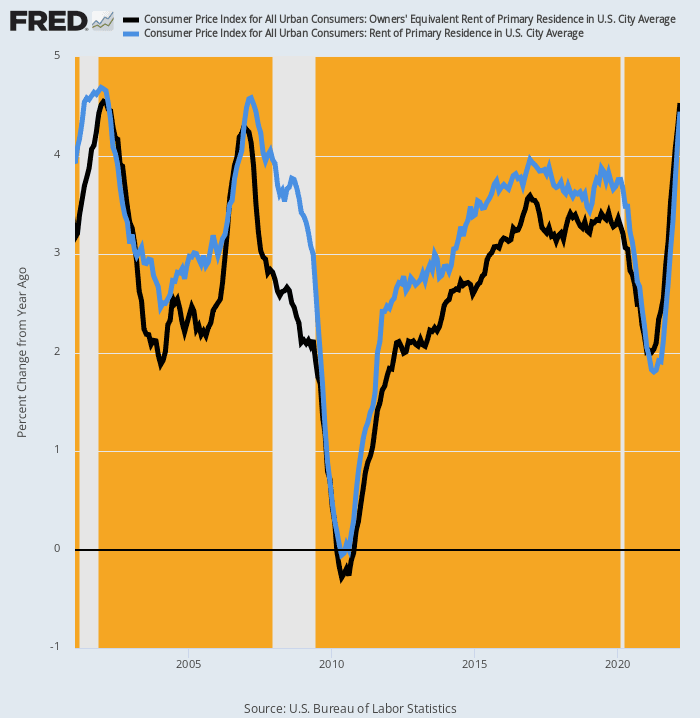
For instance, the CPI has had a temporary reprieve from from rising shelter costs, which account for 25% of the weight in the headline index and 40% of the less food and energy version of the CPI. As recently as April 2021, the Y/Y rate had dropped to 2.0% for the OER (owner’s equivalent rent) and 1.8% for the shelter index for direct renters.
But those number are already up to 4.5% and 4.4%, respectively, while future escalation is rather certain to trend far higher than the peaks of 2007 and 2001.
Y/Y Change In CPI For OER And Rent Of Primary Residence, 2001-2022
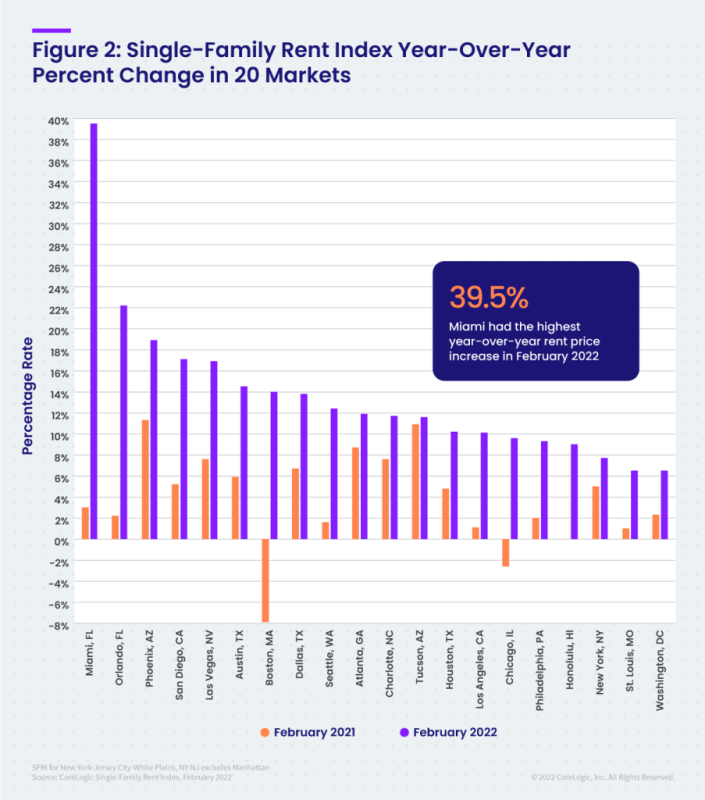
In fact, the Core Logic single-family rent index was up by 12-14% during February and is heading still higher. And these gains have been consistent across all price-tiers.

Moreover, the rate of escalation leaves little to the imagination. The chart below compares the Y/Y increase for February 2022 with that for February 2021 for the 20 top markets. In the case of some metropolitan areas, the increases have been astronomical.
Change in Y/Y Increase Rate: February 2021 Versus February 2022:
- Miami: 3.2% versus 39.5%;
- Orlando: 2.0% versus 22.2%;
- Phoenix: 11.0% versus 18.9%;
- San Diego: 5.2% versus 17.1%;
- Las Vegas: 7.7% versus 16.9%;
- Austin: 6.0% versus 14.5%;
- Boston: -8.0% versus +14.0%.
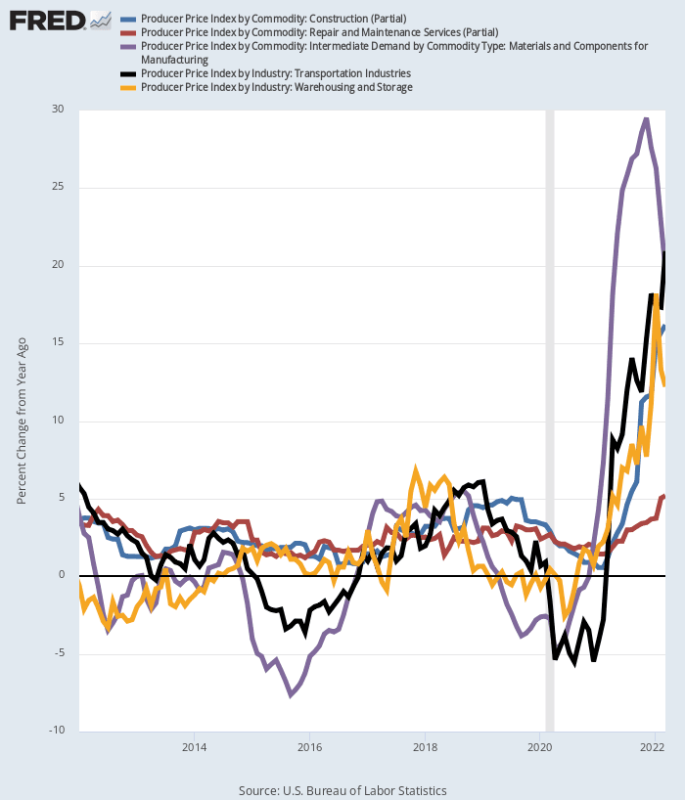
Likewise, across a whole range of industries there is a tsunami of inflation coming up the pipeline via the producer price index. Here are the March Y/Y gains, which are off-the-charts compared to the more subdued rates of gain that prevailed between 2012 and 2019:
- PPI Transportation Services: +20.9%;
- PPI Materials And Components For Manufacturing: +19.7%;
- PPI Construction Services: +16.2%;
- PPI Warehousing and Storage: +12.7%;
- PPI Repair And Maintenance Services: +5.2%.
Y/Y Gain In Selective Producer Price Index Components
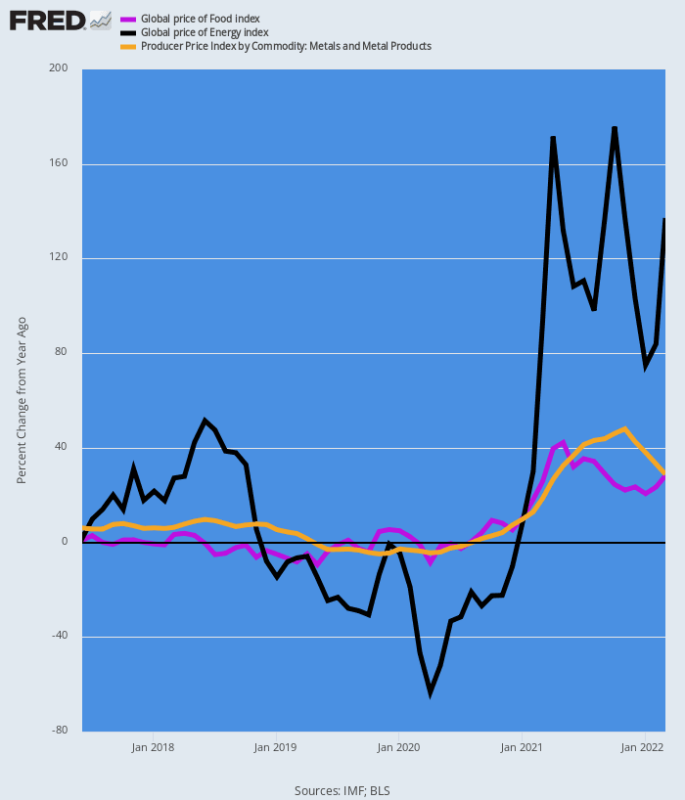
Finally, the commodity price indices leave nothing to the imagination. The chart below depicts the Y/Y inflationary tide that is barreling down the pipeline.
At length it will work its way through producer prices and into the headline CPI, even if commodity prices peak at current level, which they show no sign of doing given the continuing disruption in the energy, food and metals entrepots on the Black Sea.
Year Over Year Change Commodity Price Index Change:
- Energy: +137%;
- Food: +28%;
- Metals: +28%;
Y/Y Change In Commodity Prices
So, yes, the Fed started today with a 50 basis point increase in the Fed funds rate. But that’s barely a down-payment on what it will take reel-in the rampant inflation now underway.
So the bond vigilantes are indeed on the comeback trail, even if Wall Street still has its head buried deep in the sand.
Republished from the author’s page.
Join the conversation:
Published under a Creative Commons Attribution 4.0 International License
For reprints, please set the canonical link back to the original Brownstone Institute Article and Author.