The title of this post should have been given to a study that was published in 2022. I have missed that publication until recently, perhaps because of its uninformative title: “Nursing home quality, COVID-19 deaths, and excess mortality.” There is nothing to suggest earthshaking findings.

The inference from the lengthy paper is the opposite of what many would have thought: the greater the mitigation efforts in US nursing homes, the higher the death toll during the pandemic. Those efforts not only largely failed to reduce Covid mortality, but they also added non-Covid deaths. The more they tried to mitigate, the worse the outcome was.
A working version of the paper was circulated in October 2020. The first manuscript was submitted to the journal in March 2021, and it took the authors ten months to submit the final version, much longer than the typical timeline. I assume that the authors did not expect the results yet courageously accepted them. To ensure their validity, they added more data and performed extraordinary “robustness analysis.” It seems that the authors worked hard to please reviewers (likely anonymous) who probably preferred that the manuscript be buried.
I constructed three samples of key results from Table 3, highlighted numbers, and added arrows.
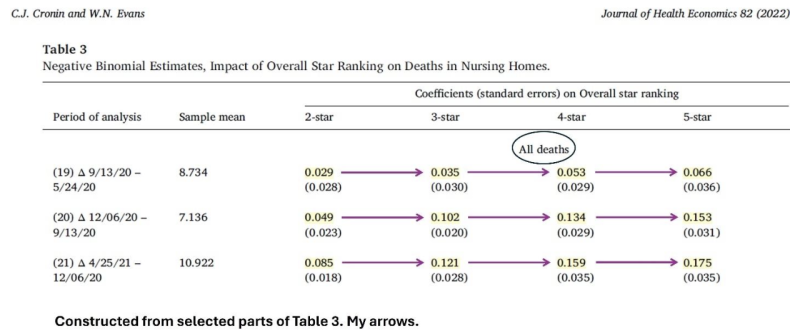

Without going into a technical explanation, the highlighted numbers above tell us that overall mortality in US nursing homes was associated with their quality ranking: the higher the quality, the higher the number of deaths. These results are consistent in three consecutive periods: May through September 2020, September through December 2020, and December 2020 through April 2021. Moreover, the relationship between quality ranking and mortality became stronger over time. It is also “monotonic;” namely, observed in every consecutive pair of quality ranking. (The group of 1-star ranking is missing because it serves as the reference for others.)
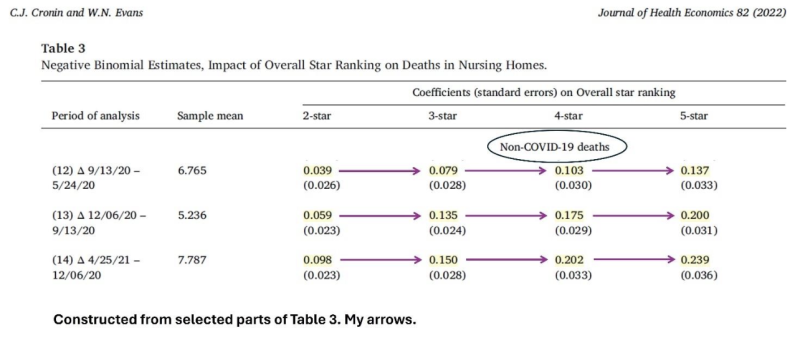
Why was the quality ranking of a nursing home related directly, rather than inversely, to all-cause mortality during the pandemic? The answer is also shown in Table 3: the higher the ranking, the higher the number of non-Covid deaths.

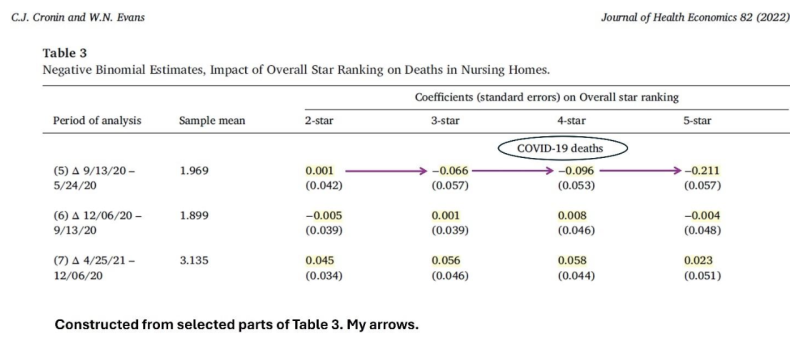
Was the quality ranking of a nursing home inversely associated with Covid mortality?
Only in the first period do we observe an inverse association (three consecutive negative numbers). And it was insufficient to negate the direct association with non-Covid mortality.

Why did non-Covid mortality increase when the quality of a nursing home was higher?
The authors propose the most likely causal explanation. Quality ranking was a surrogate for adherence to mitigation guidelines. The higher the quality of a nursing home, the more strictly official guidelines were followed. And those guidelines had a wide range of adverse consequences, which the authors describe as “unfortunate downsides to these early policies that could have negatively impacted nursing home resident health.”
Citing relevant studies, they specify some of the mechanisms: extreme isolation, which may be deadly in Alzheimer’s; unsupervised meals leading to weight loss; a lack of communal activities, which reduced exercise and increased the time spent in bed; and a large decline in regular medical care of frail, elderly residents. These plausible mechanisms are documented in horrific personal stories.
I diverge from the authors on two main points. First, they don’t say a word about the substantial misattribution of deaths to Covid. Second, and more important, they believe that the vaccination of nursing home residents played a significant role in early 2021.
I devoted several essays to this topic (The Covid Pandemic: Unconventional Analytical Essays). The effectiveness of Covid vaccines against Covid death was temporary and mediocre at best. Most likely, it was near zero or negative in the frail elderly.
By now, it is widely acknowledged that Covid vaccines did not reduce the risk of infection, but officials still claim that they reduced the risk of death if infected. Using data from Table 1 in the article, I will show that the case fatality rate (CFR) did not decrease during the vaccination campaign. Nor did Covid vaccines reduce Covid and all-cause mortality in that vulnerable population. Lastly, I will use the paper’s data to compute rough estimates of the excess mortality in US nursing homes and the share that should be attributed to detrimental mitigation efforts.
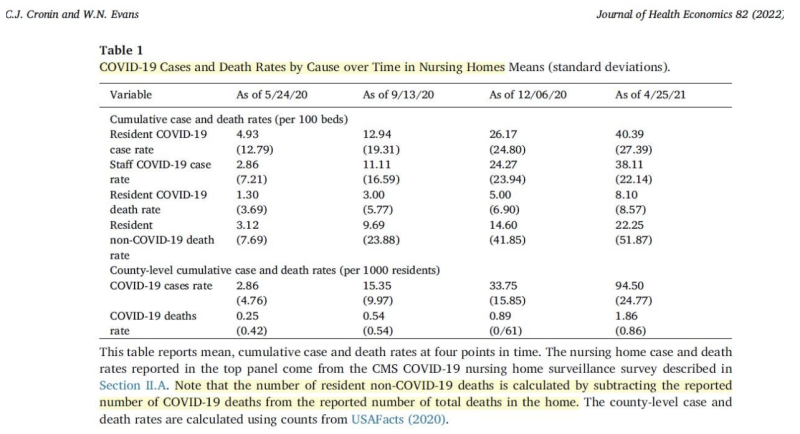

The authors reported only cumulative rates at four time points, unevenly spaced. The last period contained the vaccination campaign (as of January 2021). My table below shows the rates of Covid cases and deaths in each period and overall (almost one year).
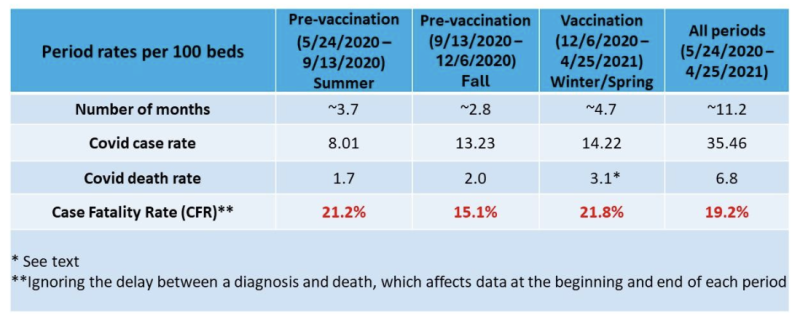

The CFR, as computed from the paper’s data, did not decrease in the last period, despite a high rate of vaccination in nursing homes. It was virtually identical to the CFR in the first period and higher than the CFR in the second period.
Based on CDC data, about 25% of Covid deaths in the US were misattributed in the first five months of 2021. These deaths were caused by other underlying conditions and would have happened even if there were no pandemic. They did not contribute to excess mortality. If we apply the correction to the last period (winter/spring), the rate of true Covid deaths was 2.3 (instead of 3.1), and the CFR was 16.2% (2.3/14.22), similar to the CFR in the immediate pre-vaccination period.
Both computations lead to the same conclusion. The CFR during the vaccination period was similar to the CFR in an earlier period, either the first or the second.
The next table shows the monthly death rates (Covid, non-Covid, and all-cause) in the same periods. These rates (per 100 beds) were computed by dividing the period rate by the number of days in the period and multiplying by 30.
In the last row, I estimated the rate of all-cause deaths per 100 residents (%) by taking into account estimates of occupancy in each period.
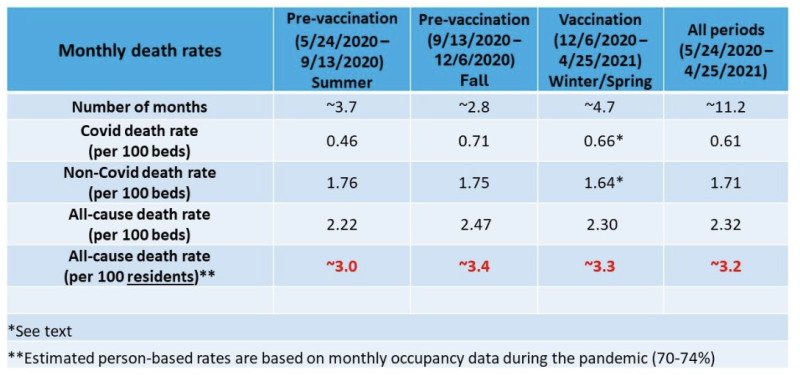

If we apply the previous correction to the third period (winter/spring), the rate of true Covid deaths was 0.49 instead of 0.66, and the rate of non-Covid deaths was 1.81 instead of 1.64. These rates (per 100 beds) are similar to the corresponding rates in the first period (0.46 and 1.76). They are somewhat higher when taking lower occupancy into account. Either way, the monthly rate of Covid deaths during the vaccination period was not lower than the rate in the first period without vaccines.
The interim period was the shortest. As expected every year, monthly all-cause mortality was higher in the fall than in the summer, but it appears to be due to higher Covid mortality alone. This might not be the case, though, as the misattribution of deaths to Covid likely persisted throughout the pandemic at a varying rate. Time-dependent variation in misattribution, which is difficult to estimate, adds some uncertainty to any study of trends in Covid mortality.
Regardless, all-cause mortality per 100 residents did not materially differ between winter/spring and fall (last row). Neither the benefit of Covid vaccines, if any, nor their (unquestionable) short-term fatality is reflected in all-cause mortality. The frequencies were low.
Overall, about 3.2% of the residents have died each month. That’s almost 40% in one year. Can we estimate the excess mortality in this vulnerable population?
Rough calculations below, along with heuristic arguments.
The high mortality rate of people who are admitted to a nursing home is well known, but data are sparse. A US study dating back to 2012–2013 reported 35% yearly mortality of newly admitted residents. However, residents who are observed during one year have been admitted at various earlier times. Some of them are older but perhaps healthier (survivors). A Norwegian study of newly admitted residents found stable mortality of the surviving cohort over three years of follow-up. About one-third of the remaining cohort have died each year.
If the expected (“normal”) mortality in US nursing homes was 33% during the pandemic, the excess mortality over 12 months was around 20%. And if the expected mortality was only 30%, excess mortality was around 30%.
Although the death toll was very high, many lives were probably shortened by months, not years.
How much of the excess mortality may be attributed to futile and harmful mitigation efforts, as revealed in the paper? I offer a tentative range of estimates.
Table 3 shows estimates of excess mortality in each period for a 2-star quality ranking or higher, relative to nursing homes with a 1-star ranking. Combining these numbers by simple math yields about 10% excess mortality in 2–5-star nursing homes during a period of almost one year.
If the lowest-ranking nursing homes (1-star) roughly estimate the expected mortality with no mitigation at all, the toll of mitigation efforts (10%) accounted for one-third (10/30) to half (10/20) of the excess mortality in 12 months.
Is my range of estimates plausible? Can we attribute at least one-third of the excess mortality in nursing homes to mitigation efforts? Could it have been even higher?
I think that the authors of the article would not be surprised. For example, they write (page 14):
In the latter of these three periods (row 21), five-star homes experienced 17.5 percent more total deaths than one-star homes…By our estimates, all of these excess deaths are due to non-Covid causes.
An anonymous nursing home expert, who analyzed data from the country’s 15,000 facilities, was cited back in November 2020: “…for every two COVID-19 victims in long-term care, there is another who died prematurely of other causes.” And matters got worse in that winter.
I have studied the share of non-Covid excess deaths in the US, in Arizona, in my Arizona county, and in Israel. The results have been consistent. At least 15%, and up to one-third, of the excess mortality may be attributed to the panic response in all its forms, including futile mitigation efforts. That share must have been higher in the frail population of nursing homes. It was certainly not lower.
The study I discussed here should have been featured in mainstream media. The findings are solid and devastating. I suspect that few have heard about it. That’s not surprising, however.
Join the conversation:


Published under a Creative Commons Attribution 4.0 International License
For reprints, please set the canonical link back to the original Brownstone Institute Article and Author.


