
By April 2022, the number of reported Covid deaths (993,739) had accounted for almost all of the CDC estimate of excess deaths (about 1,080,000). The official narrative will tell you that most of the difference is missing Covid deaths – people who died from Covid but were not diagnosed.
That’s a simpleminded summary.
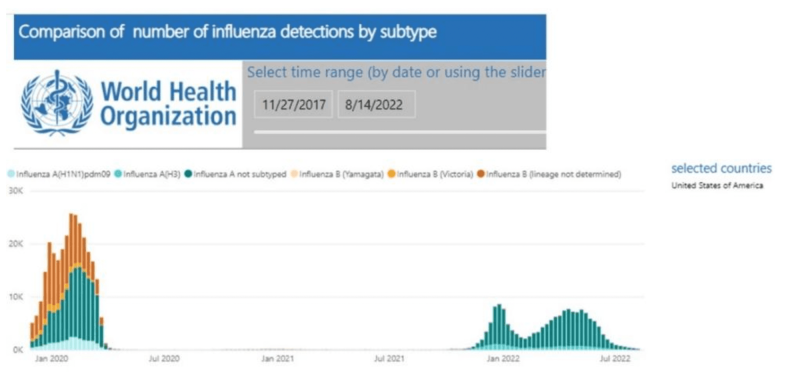
First, flu returned last winter (Figure 1) and its share in excess mortality is unknown. A comparison of Covid deaths with excess deaths must be truncated in September 2021, before the beginning of the flu wave.
Second, Covid deaths might have been missed early on, but it is absurd to assume that they continued to be missed throughout the pandemic. On the contrary, liberal coding rules, financial incentives, extensive testing, and a Covid-oriented mindset must have led to overcounting of Covid-related deaths.
Third, lockdowns, social isolation, fear-mongering, and disruption of normal life took their toll, too. There is no doubt that those baseless interventions have cost (and will cost) lives. So the question is not whether they contributed to excess mortality, but how much? What percentage of the excess mortality in the US is due to panic reaction and official fear-mongering? How many excess deaths are not accounted for by Covid?
Sources of data
Three sources of data were used to check the robustness of the main results (qualitatively), and to obtain a range of estimates: 1) CDC excess death file (weekly estimates), from which it is also possible to compute weekly Covid deaths. 2) CDC Covid death file (cumulative by each day), from which weekly deaths can be computed. 3) Our World in Data (OWID) website, from which Covid deaths and estimated excess deaths can be computed between various dates.
Cutoff dates for selected periods were dictated by weekly end-dates in the CDC excess death file. Available OWID dates were within two days.
Unaccounted excess deaths
Figure 2 shows data from an 18-month period – April 2020 through September 2021 – terminating the observations before the return of the flu. Counts of Covid deaths are shown from the three sources, and estimates of excess deaths from two. The difference between excess deaths and Covid deaths is unaccounted excess deaths.
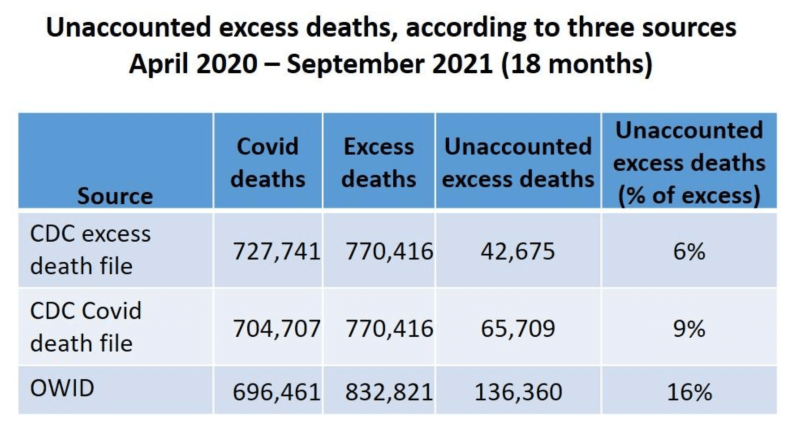
The number of Covid deaths differs among the three sources by a few percentage points. The OWID count is lower than CDC sources, but its estimate of excess deaths is higher. As a result, the OWID estimate of unaccounted excess deaths is higher.
The disagreement on Covid deaths between two CDC sources is unclear. A close examination found almost perfect agreement on the cumulative number by some dates (e.g., by July 31, 2021), but substantial disagreement in some intervals, as will be seen shortly.
Notice that the count in the CDC Covid death file is closer to the OWID (a difference of about 8,000) than to the CDC excess death file (a difference of about 23,000). That was consistent in various intervals.
Overall, the share of unaccounted excess deaths over the 18-month period was 6-9% (CDC) or 16% (OWID). This summary, however, is hiding important variation over time.
Three consecutive periods
Review of weekly estimates revealed two periods with a significant percentage of unaccounted excess deaths (April-December, 2020 and June-September, 2021), separated by a five-month period (January – May, 2021) in which the opposite was observed: the number of Covid deaths exceeded the estimate of excess deaths. It was seen in 20 of 21 weeks of that period.
The data for each of the three periods is shown next.
First period
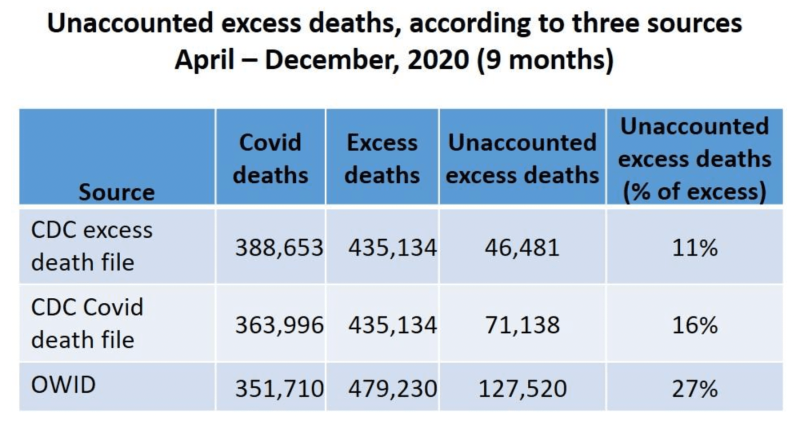
In the first nine months of the pandemic, the share of unaccounted excess deaths ranged from 11% to 27% of all excess deaths, depending on the source of data (Table). The OWID estimate is higher than CDC-based estimates due to a lower count of Covid deaths and a higher estimate of excess deaths (as seen in the entire period.) Notice, again, that the count of deaths in the Covid file is closer to the OWID than to the excess death file.
Interim period
At the beginning of 2021, the pattern was reversed. The number of Covid deaths exceeded the estimate of excess deaths, indicating overcounting of Covid deaths (Table). A so-called Covid death that did not contribute to excess mortality was not caused by Covid. It was death “with Covid,” or sometimes death “with a positive PCR.”
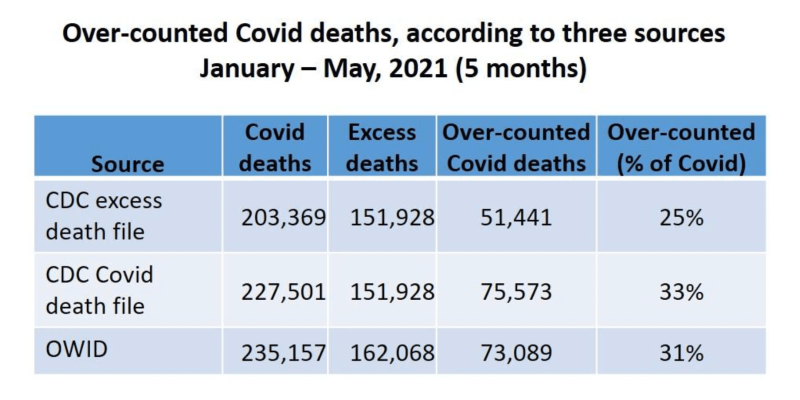
Other than data error, the only alternative explanation to overcounting is overestimation of the “normal” number of deaths (by both sources), resulting in underestimation of excess deaths. There was no drastic change, however, in the CDC estimates of weekly expected deaths, which gradually declined from about 61,000 at the beginning of January to about 55,000 by the end of May.
Misattribution of deaths to Covid during that five-month period was substantial: One-quarter to one-third of reported Covid deaths would have happened regardless of a Covid diagnosis.
Direct evidence of misattribution requires selecting a large sample of death certificates from different times, retrieving the associated medical records, and reclassifying Covid deaths by a panel of experts. Don’t count on the CDC to initiate a study that might shatter the official narrative.
Last period
The results for the last period are striking (Figure 5). Not only do we observe, again, unaccounted excess deaths, but their share is substantially higher than in the first part of the pandemic. Unaccounted excess deaths make up 26% to 43% of the excess mortality in these four months, as compared with 11% to 27% in the first nine months. The average number of unaccounted excess deaths per month was doubled (CDC data) or increased by almost 50% (OWID).
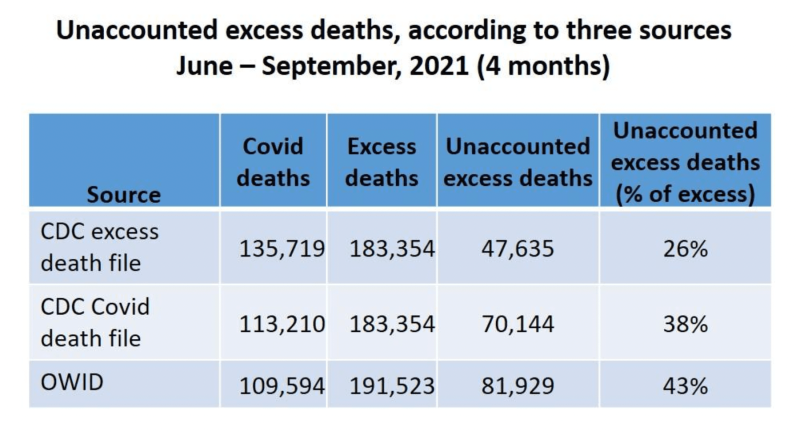
What has accounted for these 47,000 to 82,000 excess deaths?
The last period contained the rising part of the Delta wave (as of July). Were some Covid deaths of vaccinated people not attributed to Covid (because the vaccines were promised to be 95% effective)? Did some of those deaths result from the continued effects of panic and fear-mongering? Were some of them vaccine fatalities?
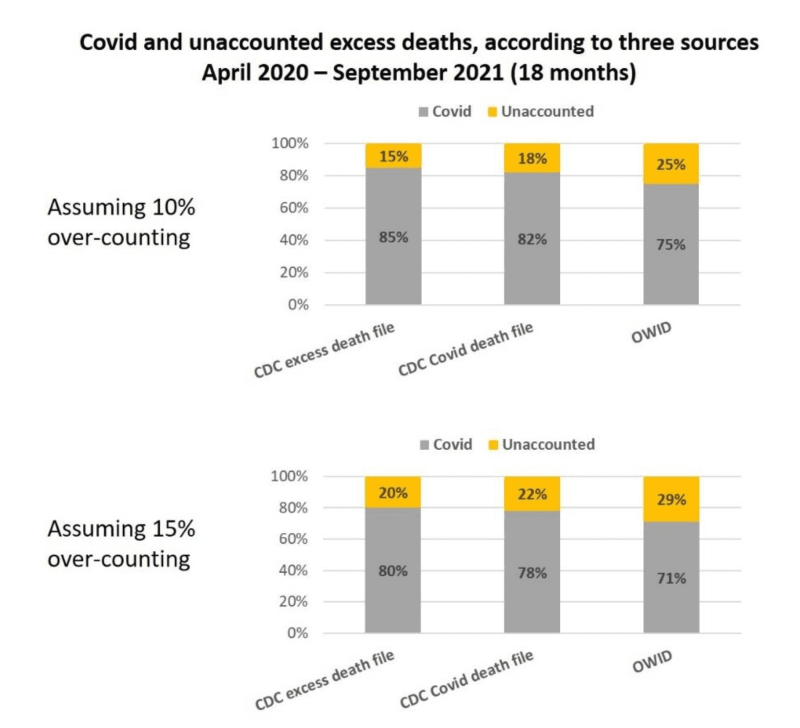
Estimates of unaccounted excess deaths (April 2020 – September 2021)
The first table (Figure 2) showed 6-16% unaccounted excess deaths over an 18-month period. That computation assumed that no death was misattributed to Covid, which is nonsense, of course – on both theoretical grounds and empirical evidence. We just saw substantial overcounting in the first five months of 2021.
A conservative estimate of misattribution over the 18-month period would allow for just 10%. That is, 90% of reported Covid deaths were true Covid deaths. The remainder belong to the category of unaccounted excess deaths. A realistic estimate might be 15%.
On these two assumptions, unaccounted deaths make up 15% to almost 30% of the excess mortality (Figure 6). The average of the six estimates is 21%.
Were these unavoidable pandemic deaths?
The CDC and other officials will call these deaths “indirect pandemic deaths.” They are not. Most of these deaths would not have happened if the Covid pandemic were handled like a previous flu pandemic – without fear-mongering, without lockdown, without symbolic masks, and without disruption of normal life. One journalist attributed them to “circumstances of the crisis.” Who created these circumstances?
The mystery of unaccounted excess deaths in the US is solved, at least in part. Many of them are accounted for by poorly justified interventions and relentless impositions on normal human activity. At least 115,000 deaths belong in that category and the true number might be twice as high.
Join the Conversation
Published under a Creative Commons Attribution 4.0 International License
For reprints, please set the canonical link back to the original Brownstone Institute Article and Author.