
According to the CDC, the United States of America lost 3,358,814 of its citizens in 2020, an age-adjusted increase of 15.9% compared to 2019. For the CDC, the reason for this increase is apparently self-evident and clear : COVID-19, which “has become the third leading cause of death.”
But – is this true or even likely?
Let us compare the age distribution of the deaths in the whole population to the one in the group whose deaths were attributed to COVID-19. The numbers are the CDC’s, the calculation of percentages is straightforward (Number per age group / Total number * 100):
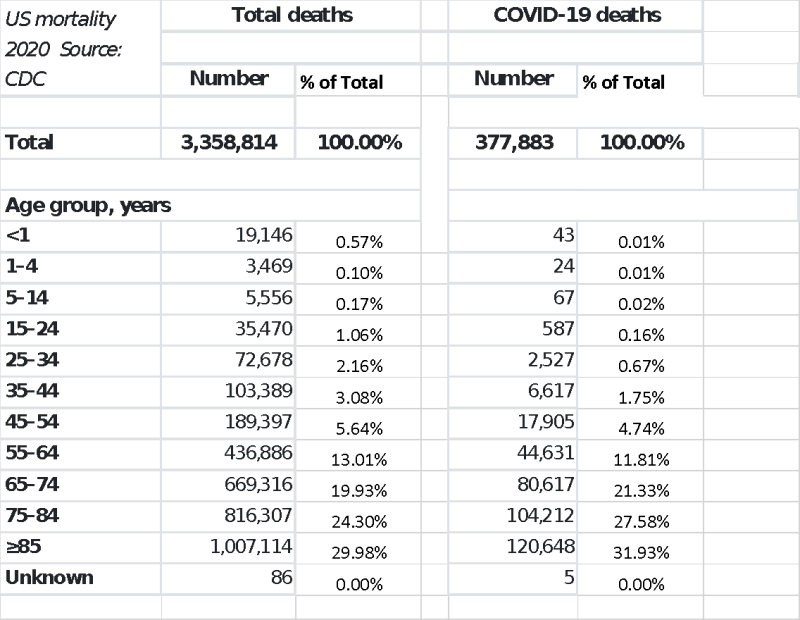
Like everywhere else in the world, the group (cohort) of people who died “of or with COVID-19” reached an average age similar to (even a little higher than) the general population.
This is what the age distributions look like graphically:
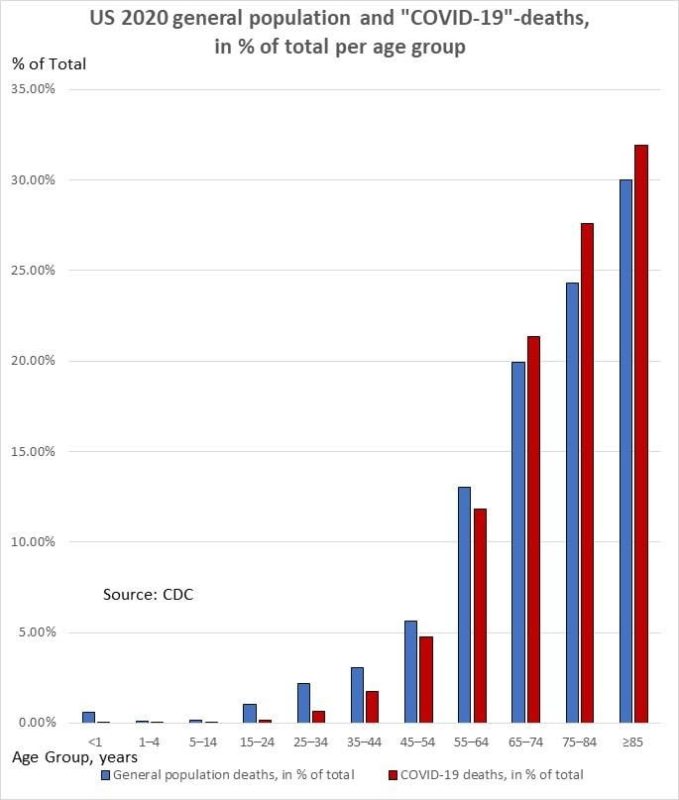
Like everywhere else in the world (see my recent article), the coronavirus (or – rather – the positive PCR test) looks very much like a random variable with regards to the observed result “death” – like athlete’s foot, like wearing red socks, like any other common cold virus.
Given that, after almost a year of mass testing, the cohort of PCR-test positives can certainly be considered a representative sample of the general population (with perhaps the only exception of the very young), this is what every statistician and epidemiologist worth his or her salt would have to conclude: The positive Corona-test is a random variable in relation to the observed result “death“.
To put it differently – why should the cohort of Corona test-positives reach a higher average age than the rest of the population, which characteristic would grant this particular cohort a longer than average lifespan?
Of course, severe forms of respiratory infections caused by/with SARS-CoV-2 do exist. Of course, our medical institutions must treat, help and support, to the best of their knowledge and capabilities, each and every one of the people affected. Of course, individual cases can be heart-breaking. Of course, hospital capacities may be stretched during flu seasons (they generally are).
On average, however, the “COVID-19 deaths” would have left this world at the same time, with Corona or from/with another virus or another disease. (In fact, a high number of them did probably die of something else than COVID-19.) We are not immortal. On average, we die at our average age of death.
As a group, the COVID-19 deaths are part of normal and, in the last resort, unavoidable population mortality.
Why, then, has the US, why have some (but not all!) countries observed significant excess mortality in 2020?
I do not pretend I have a definite answer to this question; it still needs to be analyzed in much further depth, and we can only hope that this will actually happen.
What one can however say is that in 2020, two disruptive events occurred, each with a potential influence on population mortality: a flu-like pandemic, due to SARS-CoV-2, and an unprecedented societal and political reaction (panic, lockdowns etc.) to this virus. A number of authors have already collected evidence that the second factor has had an important effect (see also the website “Collateral Global“ with many references).
Let us go back to the CDC data: In order to allow comparisons over the years, the CDC calculates a standardized death rate per 100,000 people of each age group. The death rates for 2019 can be found here: in the graph under the heading: “Did age-specific death rates in 2019 change from 2018…? “, the ones for 2020 again here: in brackets behind the raw numbers in the table headed: “Provisional number and rate of total deaths and COVID-19–related deaths…”
What the CDC has (conspicuously?) not done, is to compare the age-specific rates for 2020 to the ones in 2019, to calculate the change, and then to relate this change to the age-specific COVID-19 death rates. Here are these data :
| US Death Rates per 100,000 population | ||||
| Total 2019 | Total 2020 | Change | COVID19 2020 | |
| Age Group | ||||
| 1-4 | 23.3 | 22.2 | -1.1 | 0.2 |
| 5-14 | 13.4 | 13.6 | +0.2 | 0.2 |
| 15-24 | 69.7 | 83.2 | +13.5 | 1.4 |
| 25-34 | 128.8 | 157.9 | +29.1 | 5.5 |
| 35-44 | 199.2 | 246.2 | +47.0 | 15.8 |
| 45-54 | 392.4 | 467.8 | +75.4 | 44.2 |
| 55-64 | 883.3 | 1,028.5 | +145.2 | 105.1 |
| 65_74 | 1,764.6 | 2068.8 | +304.2 | 249.2 |
| 75-84 | 4,308.3 | 4,980.2 | +671.9 | 635.8 |
| >85 | 13,228.6 | 15,007.4 | +1,778.8 | 1,797.8 |
| Source: CDC |
The increase in age-specific death rates in the younger parts of the population (15 – 54 years old) has been extraordinarily significant – it is above 20%. And one cannot argue the hypothesis that this increase is due to COVID-19. Just look at the numbers: the COVID-19 death rates in these age groups are far too small. Something else must have led to this increase in mortality in the younger population.
In contrast to the COVID-19 deaths, these are true Life Years Lost – many of them.
Perhaps they can help explain the excess mortality which the United States has observed in 2020. As said, much further and deeper analysis is required. Let us hope that in the end, sober reason and rational science will prevail against the hysteric and dogmatic atmosphere which has taken hold of almost the whole world.
Join the Conversation
Published under a Creative Commons Attribution 4.0 International License
For reprints, please set the canonical link back to the original Brownstone Institute Article and Author.