

THE LANCET Regional Health — Europe
Dear Editor,
My letter is concerned with a topic of utmost importance: The effect of the flu vaccine on flu-related death. That’s the ultimate endpoint of interest for vaccine effectiveness (VE) research, yet it is not captured in most studies that employ the test-negative design.
Faksova et al. (January 2026) reported in your journal results from a large cohort study of the flu vaccine in 2024–2025 in elderly residents (age≥65) of three Nordic countries. The estimated VE against flu-related death was 63%, which corresponds to a risk ratio (RR) of 0.37. How robust is the result? What does sensitivity analysis show?
The authors relied on a matched design to avoid confounding bias, a major threat in observational research. Unvaccinated members of the cohort were matched to the vaccinated (one-to-one matching) on several variables, including key comorbidities.
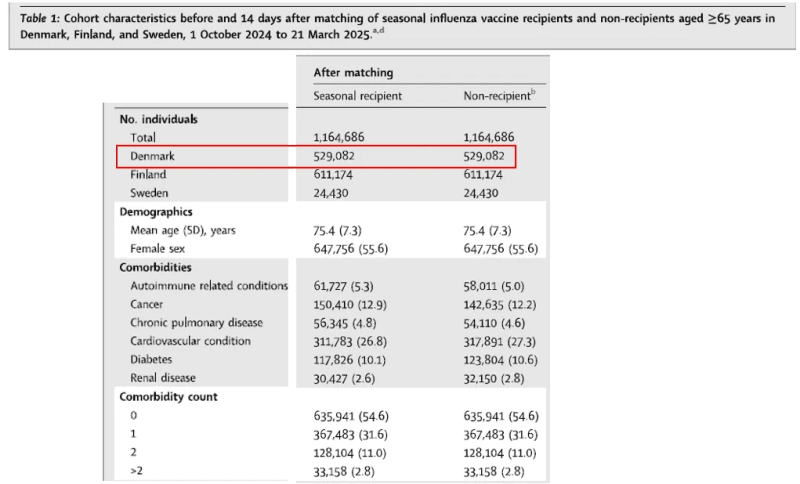
Sweden was not included in the mortality analysis (small numbers), and the mortality graphs were displayed by country (Denmark, Finland). I will examine the data from Denmark, a matched cohort of over one million people.
Graphs of cumulative mortality by vaccination status were displayed as of 14 days after a matched index date. For a vaccinated person, the index date was the vaccination date; for their unvaccinated counterpart, that matched date was just a random date on the calendar. I will return to this point later when we discuss their health status.
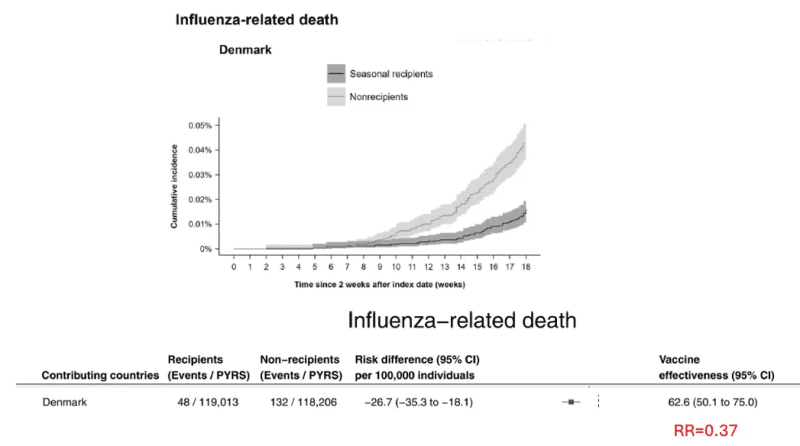
Based on a total of 180 flu-related deaths, the risk ratio in Denmark was 0.37 (63% effectiveness). The denominators, person-years, were similar, so a simple ratio of the number of deaths gives almost the same result (48/132 = 0.36).
The authors were aware of the healthy vaccinee effect, a type of confounding bias, and they examined several outcomes for which no effect of vaccination is expected. These are called “negative control outcomes.” All-cause death was one such outcome because flu mortality was a tiny fraction of all-cause mortality (<2%), and we do not expect an effect of the flu vaccine on death from other causes. The results for this endpoint — graphs and estimates — were buried in a long supplementary appendix and were stated in one sentence in the main manuscript in a subsection titled negative control outcomes.
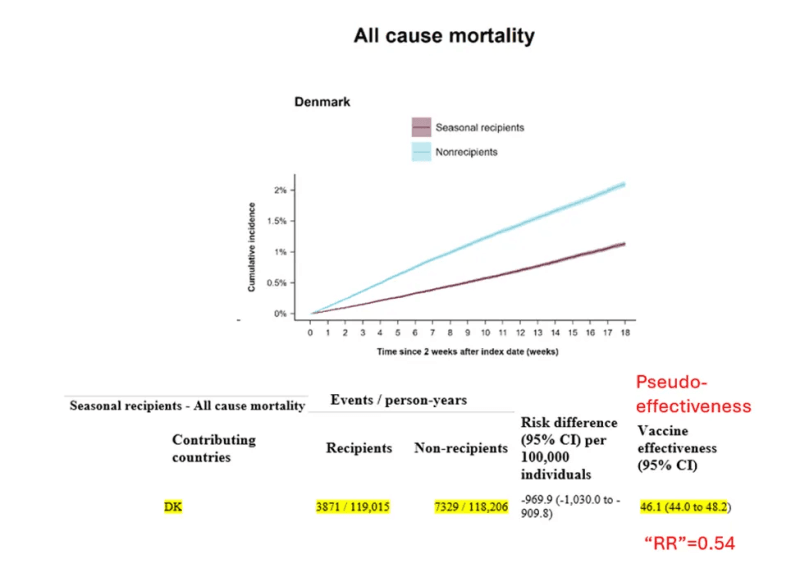
Evidently, matching failed to remove the healthy vaccinee bias. The mortality graphs diverge, and quantitative analysis resulted in a “risk ratio” of 0.54 (pseudo-effectiveness of 46%). Again, since the denominators were similar, a simple ratio of the number of deaths gives almost the same result whether we divide the number of all-cause deaths (3,871/7,329 = 0.53) or subtract the small number of flu-related deaths (3,823/7,197 = 0.53). We have evidence that despite matching, the vaccinated were healthier than the unvaccinated, so the estimated risk ratio of flu-related death (0.37) is severely biased. In the Discussion, the authors try to downplay the implication.
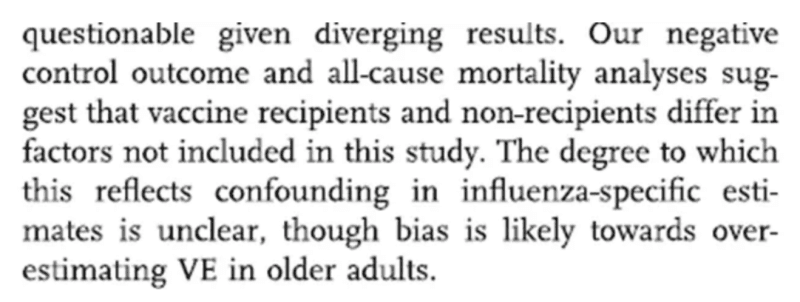
The degree of confounding for flu-related mortality is very clear — it is strong — and correcting the overestimated VE is not simple. The authors “caution against the use of these negative control outcomes VE estimates for direct calibration of influenza VE results.” I would caution against using the phrase “direct calibration” for “removing bias.” I would also caution against presenting a severely biased estimate against flu-related death without any attempt to get closer to the truth.
According to one correction method, we divide the two biased risk ratios, RR (flu death)/RR (non-flu death) = 0.37/0.54 = 0.69, which is equivalent to multiplying the former (0.37) by the inverse of the latter (1/0.54 = 1.85). The origin of the method and its foundation are explained elsewhere. (The E-values, which were displayed in Table S12, are related to the topic. However, the authors did not acknowledge that the E-value for all-cause mortality is not “implied bias” but actual, minimal healthy vaccinee bias because the causal RR is about 1.)
There is more. The magnitude of the bias was underestimated.
The authors restricted the analysis to deaths that have occurred two weeks after the index date because they did not expect any benefit of vaccination against flu-related outcomes in that interval. However, the parallel approach for all-cause deaths (essentially non-flu) resulted in an underestimation of the healthy vaccinee effect. People who were vaccinated were unlikely to die from various causes within two weeks after the index date (“healthier”), whereas many of those who were “sick enough” to be at risk of death from various causes within that window were not vaccinated. There are missing, early non-flu deaths in the unvaccinated (matched on a calendar date). Moreover, since the authors claim to have emulated a randomized trial, skipping two weeks after the initiation of treatment is unacceptable.
A hypothetical extension of the graphs back to the index date shows larger divergence, which means stronger residual confounding bias after matching (Figure).
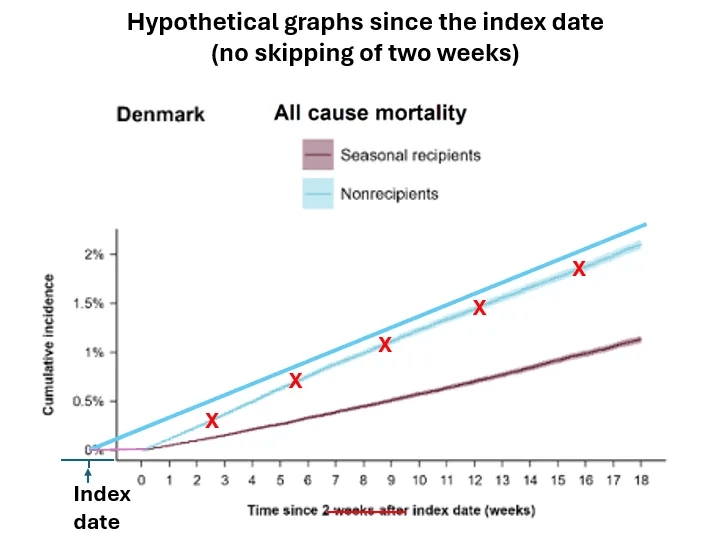
Assuming a constant slope, we can estimate the number of early deaths that were omitted in the unvaccinated (about 1,200 non-flu deaths) and estimate the correct “risk ratio” of all-cause death. It is smaller. Truncation of the first two weeks artificially reduced the true magnitude of the healthy vaccinee bias.

Using the correction method for flu-related death, we get
RR (flu death) = 0.37 x (1/0.45) = 0.37 x 2.2 = 0.81
The multiplier, 2.2, is called the bias factor or the bias correction factor. It was estimated in numerous countries — for the Covid vaccines — and consistently found to be in the range of 2 to 3. Denmark is no exception.
My sensitivity analysis is summarized in the table below.
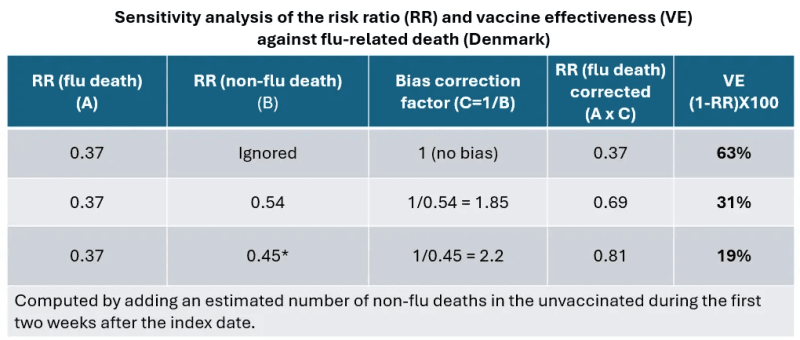
An approximate 95% confidence interval around RR = 0.81 is [0.55, 1.1], and the corresponding interval around VE = 19% is [45%, -10%]. That’s far from 63% effectiveness, and near-zero effectiveness is possible.
Randomized trials with a mortality endpoint have never been conducted for the flu vaccine, and conventional methods of deconfounding do not remove the healthy vaccinee bias, as was the case here. An alternative approach to removing the bias is called regression discontinuity. It is relatively new and not widely known.
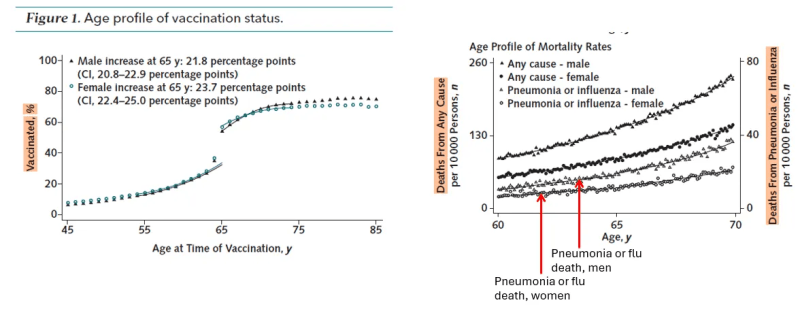
In brief, the regression discontinuity design relies on an abrupt policy-related change in the vaccination rate in the population, say, at age 65. The mortality rate of people around that age (e.g., 65–70 versus 60–65) is compared. Since people just older than 65 are compared with people just younger than 65, the two groups are largely similar except for the vaccination rate. If vaccination is effective, we expect to observe some deviation from the typical mortality trend over that age range (60–70), which means discontinuity of the regression line at age 65. Vaccine effectiveness can also be calculated from the data.
So far, only two studies of the flu vaccine have used that design: one in the UK (cutoff at age 65) and another in China (cutoff at age 70). Neither found evidence for an effect of the flu vaccine on death or hospitalization, despite a substantial increase in the vaccination rate around the cutoff age: about 20 percentage points in the UK and 30 percentage points in China.
A key result from the UK study is shown below. A sharp increase in the vaccination rate at age 65 (left figure) was not associated with any discontinuity of the mortality rates (right figure).
Since a randomized trial will never be conducted, we need more of these studies to decide if there is any effect of the flu vaccine on flu-related death in the elderly. And if there is, how strong (or how weak) it is. For sure, it was nowhere near 60% effectiveness in the study of Faksova et al.
In another paper, which was published at about the same time, Faksova et al. discuss their studies in three Nordic countries. They write:
“[S]everal supplementary analytical designs can be applied. These include prior event rate ratio (PERR) adjustment, regression discontinuity analysis (RDA) and negative control outcomes analyses. Such approaches enable contextualization of results and may improve the robustness of findings.”
I cannot agree more. The origin of the correction method I used here can be traced to PERR adjustment, and I look forward to seeing their results from regression discontinuity analysis.
I have missed your deadline for submitting correspondence on a published article (within 8 weeks of an online publication), and I doubt I could have delivered the scientific content in 400 words as the journal requires. By the way, both constraints fit a printed magazine, not a scientific journal in the digital era.
So, I am publishing my letter here. If it were published in your journal, the authors would have replied. Now they may remain silent. After all, their work was published in a journal labeled “science,” whereas mine was not.
Sincerely,
Eyal Shahar, MD, MPH
Professor Emeritus
Republished from Medium
Join the Conversation
Published under a Creative Commons Attribution 4.0 International License
For reprints, please set the canonical link back to the original Brownstone Institute Article and Author.