Closing schools worked. Closing restaurants worked. Wearing masks worked. We know they worked because the governors that ordered them said so. The CDC said so. The NIH said so.
We were granted the greatest scientific experiment COVID-19 could offer (except for the cruise ships, which provided the original scientific experiment and was ignored). Many states had (and have) wildly different policies during the pandemic. The question we need to ask and data we need to study is, if the tight restrictions worked, did they result in fewer COVID-19 and moreover total excess deaths?
Comparing one state to another, cherry-picking low-impacted Vermont to high-impacted Mississippi is dumb; they are unlike one another in geography and demographics, and importantly, obesity. Those two states are as far apart in COVID-19 death ranking as they are in obesity ranking. Mississippi is first right now in COVID-19 deaths per capita and has the highest obesity in the country. Vermont is ranked 50th in COVID-19 deaths per capita and 46th in obesity. Correlated?
Below are the highest and lowest states in COVID-19 deaths per capita and their obesity ranking.
| Top Five Highest COVID-19 Deaths | Bottom Five Lowest COVID-19 Deaths | ||
|---|---|---|---|
| State | Obesity Ranking | State | Obesity Ranking |
| Mississippi | 1 | Vermont | 46 |
| Arizona | 31 | Hawaii | 48 |
| Alabama | 3 | Maine | 29 |
| New Jersey | 45 | Utah | 40 |
| Louisiana | 4 | Alaska | 26 |
Do you see a correlation? New Jersey was hit hard early on and many fell victim to healthcare providers learning to treat COVID-19 patients and their nursing home policy. Arizona is an outlier, in part buoyed by foreign nationals sick with COVID-19 and dying in Arizona hospitals (similar results were seen in Texas and southern California). All the lower impacted COVID-19 states are low in obesity. (Is anyone surprised Alaska is not one of the lowest obesity states?)
The least restricted states throughout the pandemic include (no cherry picking here, these are the least) include the Dakotas, Florida, Nebraska, and Oklahoma. Not one of those states are in the top fifteen in COVID-19 deaths per capita.
The takeaway from all of this is that tight restrictions had no measurable impact on COVID-19 deaths. We need to understand that key messaging to those at risk (the elderly and obese; if these alone were removed from the COVID-19 deaths, there was no pandemic, a mathematical term requiring 7.4% of all deaths attributed to a new illness), protecting and advising them to be extra cautious while the population at large continues to function.
Below is an excerpt from a chapter called “The Burden of Proof” from the book COVID-19: The Science vs. The Lockdowns. This compilation is all original data compiled like this for the first time. The data analysis runs from the beginning of the pandemic in March 2020 through April 2021, fourteen months of data to accommodate for seasonality and ensure a long and large sampling. Since this list, some states shifted: for example, the southeastern states moved up in deaths per capita, and the Dakotas went from the top six to outside the top twenty in deaths per capita.
The data around COVID-19 hospitalizations and deaths had wild margins of error, up to 40% inaccuracies in some places. A White House data advisor told me it was up to 50%. The working number in this research is 30%. The inaccuracies spawned from mostly two things: the inclusion of untested probable hospitalizations and deaths; including those who died after testing positive within weeks or months but died of something else. Yes, the stories you heard about the gun or car accident victim counted as a COVID-19 death are outliers. What aren’t outliers are the tens of thousands of people that died from real health issues, including issues like cardiac arrests, cancer deaths – things that had nothing to do with COVID-19 but were counted as such.
The other consequence discussed here is lockdown deaths. There is no doubt that tens or hundreds of thousands of people died prematurely from untreated ailments, avoidance of healthcare out of fear of getting COVID-19, and to a lesser degree things like overdoses and suicides. Because of all the looseness in reporting, the highest integrity data point measuring the pandemic and lockdown impacts is looking at how many people in total died against expectations. If three million people died annually from 2015-2019 and then 3.5 million people died in 2020 and 2021, the increase is obvious. This is how we measure the pandemic and interventions holistically.
If California had fewer COVID-19 deaths per capita than South Dakota, but 3% more total excess deaths during the pandemic from all causes amidst the strictest lockdowns, was it worth it? Well, that’s a no-brainer. A better comparison may be Idaho and neighboring Oregon and Washington. Idaho was much less restricted, kids were mostly in class if they wanted, whereas the two states to their west were almost California-tight. Idaho had about 14% excess deaths compared to about 8% in Oregon and Washington. Were the mitigations worth it? That’s for you to decide. Here we will show many comparisons that suggest hard locking down produced no better results than doing little more than protecting the vulnerable and letting the populations practice personal responsibility without government mandates.
The burden was not on open states like South Dakota, Nebraska, Wyoming, Oklahoma or Florida to do better. The burden was on states mandating a bunch of restrictions to do better. If lockdown measures work, their results should be a lot better. Then we can analyze if certain mitigations are worth it. Hypothetically, if open schools resulted in a 10% increase in pediatric deaths, we have a cause and effect to weigh. Then you decide, are open schools worth 10,000 more kids’ lives lost? If open restaurants were known to result in 50% more deaths in a community, once again we can analyze if closing was worth it. If either of those things played out and the data proved the cause and effect, closed schools and closed indoor dining would have had a higher approval rating than eliminating taxes.
Fourteen months into the pandemic, the United States was +14% in all-cause deaths, meaning 14% more died than expected. Low-restricted South Dakota, Oklahoma, Florida, Nebraska, Florida and others should have far surpassed locked down states in all-cause deaths. South Dakota was +17% in excess deaths since the pandemic began. States doing worse than South Dakota that locked down harder included New Jersey (+27%), Arizona (+24%), New Mexico (+24%), Texas (+24%), California (+22%), New York (+20%), Maryland (+18%), and a dozen others. Locked down states should have had far fewer total lives lost than those open, and they did not. In many cases they did worse.
State Comparisons

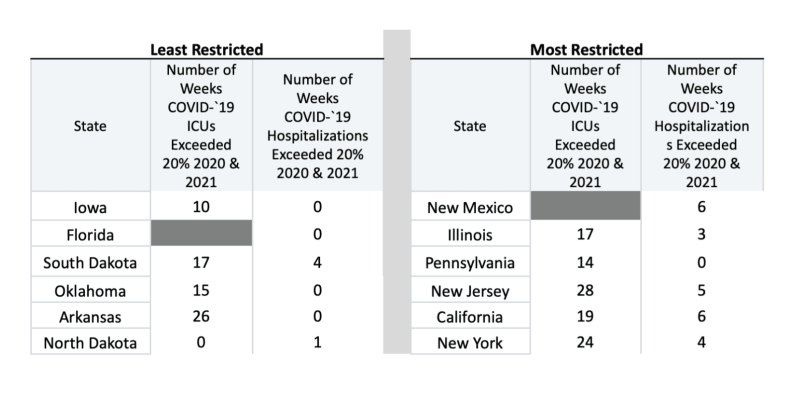
The states above are ranked by least stringent to most stringent restrictions as of April 6, 2021 according to Wallethub. Factoring into these rankings are face mask requirements, restaurants and bars open, schools open for in-person learning, stay-at-home orders and other restrictions. The obvious question is, did restrictions result in fewer COVID-19 deaths? That’s the tradeoff. Lockdowns were costly personally and financially, but if the correlation worked, you can make an argument that they were a reasonable strategy. Below are key takeaways from the data chart above.
Politics
The seventeen least restricted states were Republican-led, as were 22 of the first 23 states. There is no doubt restrictions correlated more to the party of the state governor than anything else. Of the 26 most restricted states, 22 were Democrat-led. Of the four most restricted Republican-led states, Massachusetts, Vermont and Maryland are strong Democrat-voting states. Five of the eight states with over 20% all-cause excess deaths were Republican-led, three Democrat-led.
Hospitalizations
ICU and overall hospitalizations are listed relative to state capacity. The data is directional only. A threshold of 20% is set for comparative purposes only. When communities were met with their COVID-19 surge, it’s likely a handful of hospitals were at or near full ICU capacity of COVID-19 patients for three to four weeks. A hospital is supposed to run at near capacity, like a hotel, in order to sustain. During the pandemic, outside of a four-to-six-week surge, most ran closer to 70%; during the spring 2020 lockdown, nationally most were almost completely empty and going broke. Had the CARES Act not bailed them out, many would not have made it, nor would most smaller healthcare providers. The healthcare industry would have gone broke during a pandemic without government bailouts.
Only seven states out of fifty-one (including DC) ever had more than five weeks of hospital beds occupied with over 20% COVID-19 patients. None of those seven states were among the top twenty least stringent states except Arizona. Only California reached over 20% of the ten most stringent states.
Some states did not report ICU occupation of COVID-19 patients. Of those that did, 22 exceeded ten weeks with over 20%. 34 states exceeded 20% ICU occupancy greater than five weeks, and that does not include unreported states, of which six states surely did. That means forty states had surges reach their ICUs.
Below is a comparison of the five most and least restricted states throughout the pandemic and their hospital occupancy:
Schools Open and Closed
Only two of the top ten highest deaths-per-capita states, Mississippi and South Dakota [ranked twenty in January 2022], had over half their schools open for face-to-face learning in the fall of 2020 and early 2021. This is relevant in that open schools did not correlate with higher COVID-19 deaths per capita.
Of the twenty states with 80% of their schools open for face-to-face learning in April 2021, their average COVID-19 deaths per capita were 1,654. Of the fifteen states with 50% or less face-to-face learning, their average COVID-19 deaths per capita were 1,539. The difference was insignificant. Smaller states with closed schools in Hawaii and Maine weighted that down, to where the average would have been near identical.
There was no correlation between more in-person learning and more people getting sick in communities. Hard data shows that tight restrictions did not result in any better results than light restrictions. Closing schools didn’t matter. Closing restaurants didn’t matter. Wearing masks didn’t matter. In the end two mitigation tactics worked: those vulnerable isolating, and social distancing, a form of isolation. The rest of the mitigations seem like they should have helped, but they just did not.
Grading the Governors
Not one governor performed perfectly during the pandemic and lockdowns. With media pressure, a desire to balance their constituents, and a desire to get reelected and move on to federal positions down the road, it was an enormously difficult job for all of them. For every single one, from Governors Newsom and Cuomo to Noem and DeSantis, it was the most challenging policy-making of their careers, and for any governor in perhaps American history. All grading below, like that for kids during their year-plus of remote learning, is on a curve. On that curve, here is how governors performed during the pandemic:
The A’s
Governors Ron DeSantis (FL), Kristi Noem (SD), Pete Ricketts (NE), and Mark Gordon (WY). No governors faced more media pressure than Noem and DeSantis. Noem never locked down her state. She never state-mandated face masks. She held strong during a very difficult surge in November and December 2020. She leads a state populated comparably to a metro Dallas county, and made more headlines for her stance than anyone not named DeSantis. Still, fewer than half the South Dakotan kids were forced out of class in 2020 and local governments were permitted to put up their own restrictions.
DeSantis led the third most populated state with a higher-than-average elderly population. Early on he put in protections in long-term care facilities. He locked down last and reopened in May 2020. He removed state restrictions in September 2020, even as COVID-19 activity rose in the fall. He kept more classes open in Florida than any other large population state. And with that, Florida had no worse results than the national average. The burden was not on DeSantis and Noem to beat the street with their open states. The burden was on the lockdown states to have better results and that did not happen. You could not look at a blank chart of states’ COVID-19 performance and pick out the tightly restricted versus looser states. For that, these bold governors get an A on the curve.
Mark Gordon kept schools open all 2020-2021 and for that he deserves recognition. A brief state mask mandate and allowing Teton County to require masks and close restaurants when we went climbing there in 2020 was frustrating. Still, on the curve, Gordon gets an A. Ricketts does as well, staying under the national radar while making Nebraskans glad to be Nebraskans.
The B’s
Governors Kim Reynolds (IA), Brian Kemp (GA), Doug Burgum (ND), Greg Abbott (TX), Kevin Stitt (OK), Henry McMaster (SC), Eric Holcomb (IN), Brad Little (ID), Mike Parson (MO), Asa Hutchinson (AR), Kate Ivey (AL), Gary Herbert (UT), and Tate Reeves (MS).
These governors all had state mandates at one point or another. Many of their kids missed school in 2020-2021 overall. Businesses were restricted and most had some mask mandates at one time or another. Still, we’re grading on a curve. These governors presided over fewer restrictions and few of their states ever broke the top ten in deaths per capita. Governor Abbott would have been a C had he not completely opened everything in Texas up without restrictions nor face masks in March 2021, leading the way back. That was the A move of any of these governors. Asa Hutchinson kept more kids in class than any governor not named DeSantis or Gordon.
The C’s
Governors Laura Kelly (KS), Bill Lee (TN), Steve Bullock (MT), Gina Raimondo (RI), and Doug Ducey (AZ). These governors at least allowed some kids to be in class throughout late 2020 and early 2021. Raimondo was surrounded with lockdown warriors keeping kids out of class and businesses closed, and she kept more kids in school than any state in the northeast or mid-Atlantic. Not enough kids, but we’re on a curve.
The D’s
Governors Jared Polis (CO), Ned Lamont (CT), Andy Beshear (KY), John Bel Edwards (LA), Mike Dunleavy (AK), Brad Little (ID), Mike DeWine (OH), and Jim Justice (WV). Few of these governors made headlines with their lockdown moves. None followed actual science, they went along with the pack and the polls. Their low grade is largely based on so few kids in class. Remember, science. [Jared Polis has since come around and made some sensible comments about the value of restrictions, he would be higher if this list was compiled months after my original work]
The F’s
Governors John Carney (DE), David Ige (HI), Janet Mills (ME), Tim Waltz (MN), Steve Sisolak (NV), Michelle Lujan (NM), Roy Cooper (NC), Kate Brown (OR), Ralph Northam (VA), Jay Inslee (WA), Tony Evers (WI), Larry Hogan (MD), Charlie Baker (MA), Chris Sununu (NH) and and Phil Scott (VT). Millions of their students were locked out of schools for over a year, thousands of businesses closed and they were defiant in opening up when it was clear where the science stood. The only salvage for Ige, Mills, Brown, Scott, Sununu and Inslee is that while they kept kids out of class and closed thousands of businesses, they did achieve low relative COVID-19 deaths and all-cause excess deaths. They likely would have anyway had they let kids get educated and let businesses function.
Complete Fails
Governors Andrew Cuomo (NY), Phil Murphy (NJ), Gavin Newsom (CA), Gretchen Whitmer (MI), J.B. Pritzker (IL), and Tom Wolf (PA). There’s a special place for governors that locked kids out of classrooms for a year and a half, ordered sick COVID-19 patients back into nursing homes, did not practice their own orders, shut down tens of thousands of businesses and still couldn’t beat the U.S average in COVID-19 deaths or excess all-cause deaths.
Join the Conversation
Published under a Creative Commons Attribution 4.0 International License
For reprints, please set the canonical link back to the original Brownstone Institute Article and Author.