
Sixty years ago, the first of a remarkable series of articles appeared in the medical literature describing the curious lack of cardiovascular deaths in Roseto, Pennsylvania in comparison to surrounding towns. Roseto, Pennsylvania had been settled predominantly by immigrants from Roseto Valfortore, a small town in the region of Apulia in southeastern Italy and remained a very tightly knit community.
To explain this anomaly, investigations into numerous assumed health factors such as genetics, diet, and smoking were made, but all turned up negative. These health factors were not appreciably different from the other towns in the area. Finally, the only thing left was the high degree of social support and cultural cohesion. Unfortunately, acculturation ultimately destroyed this differentiation with resulting loss of the protective effect on the population.
There persists, however, the belief that objective and easily quantifiable factors are largely responsible for equally easily quantifiable outcomes. The Robert Wood Johnson Foundation uses information from the Wisconsin Health Population Institute to publish online the County Health Rankings & Roadmaps. This is a remarkably complete ranking of virtually every county in the United States according to elements categorized as “Health Factors” and “Health Outcomes.” The Health Outcomes Data consists of data on Length of Life and Quality of Life, both given equal weight. The Health Factors Data are broken down into four main categories: Social and Economic Factors (40%), Health Behaviors (30%), Clinical Care (20%) and Physical Environment (10%).
Each of the Outcomes and Factors are comprised of a number of subfactors listed on the website. While some subfactors are negative and others positive, the values are standardized so that a higher rank in each category indicates a better result. Within each state each county is ranked according to its Health Outcome and Health Factors taken as an aggregate as well as broken down into its main components. Ranking is given as to standing in the state as well as to the Z score. The rationale for assigning weights to the ranking data in the report is contained within the working paper of the University of Wisconsin Population Health Institute available at the County Health Rankings & Roadmaps website.
While for the most part and in most areas of the country, Health Factors are indeed correlated with Health Outcomes. However, we found some interesting outliers in the data when we studied the Arizona counties a few years ago.
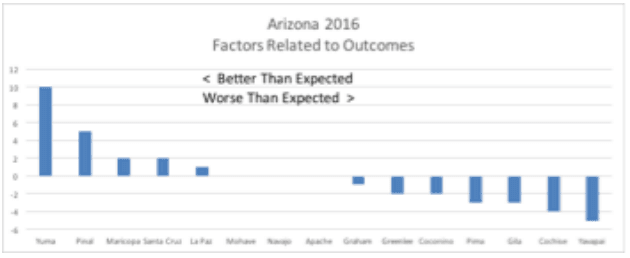
First off, there was not a simple relationship between the ranking of the Arizona counties regarding Health Outcomes and Health Factors:
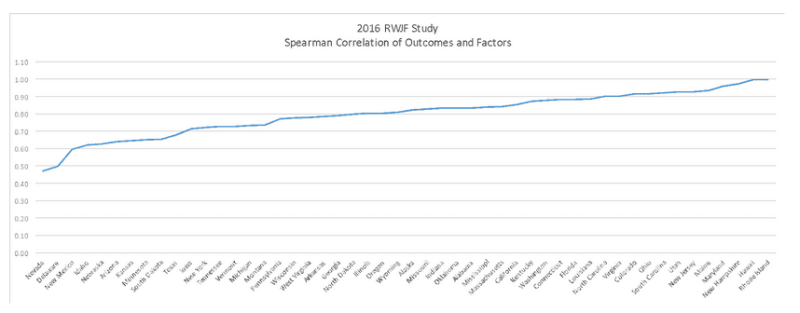
The Spearman rho calculation for correspondence was 0.6393 as opposed to that of New Hampshire which was 0.9758. Indeed, the Spearman rho for all 50 states showed considerable variation:
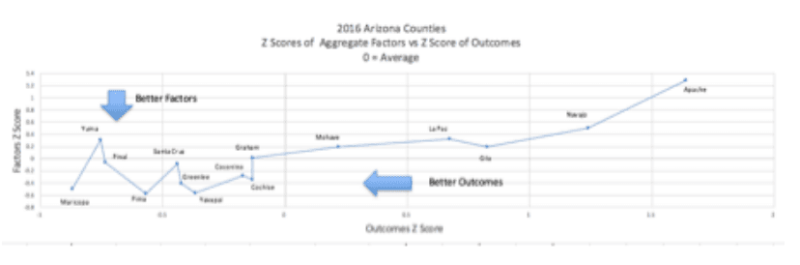
The complex nonlinear correlation was even more pronounced when the Z-scores of the individual Health Factors were compared to the Z-scores of the Health Outcomes:
First, this is the aggregate Health Factors score based on the weighting in the County Health Rankings & Roadmaps site:
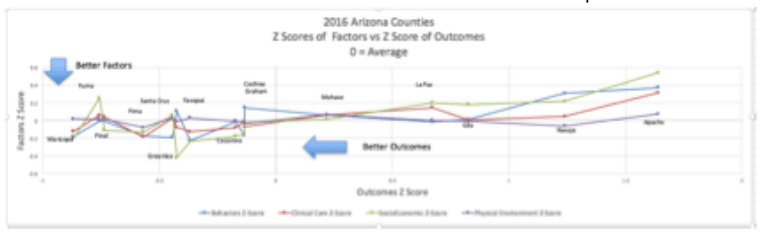
And this is when the Health Factors are broken down into their component sub factors:
Yuma’s scores on all the Health Factors are worse than Pima’s and its aggregate Health Factors score is virtually the same as that of La Paz and worse than all but Navajo and Apache and yet it ranks second in Health Outcomes. Why?
This relationship has been relatively stable over the years 2020-2017 with some exceptions.
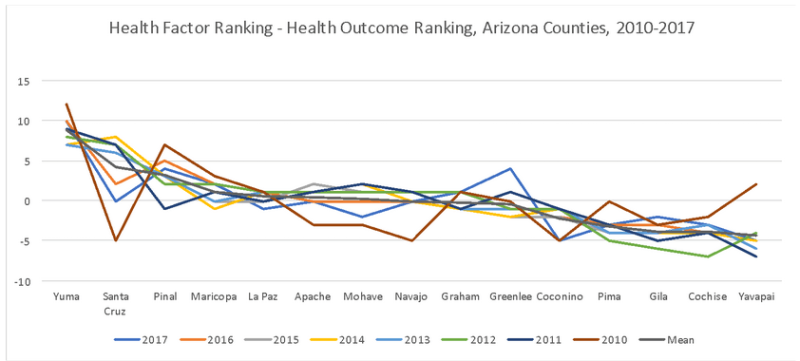
In Coconino, Gila, Pima, Cochise, and Yavapai counties, the Health Outcomes should have been better than they were. “Something else” was acting as an anchor. In Yuma, Santa Cruz, Pinal, and Maricopa counties, the Health Outcomes should have been worse than they were. “Something else” was giving a boost. Although this “something else” has been relatively stable in most counties, some year-to-year variability, particularly in Santa Cruz, can be seen. Although this can be measured, as of yet an explanation is obscure.
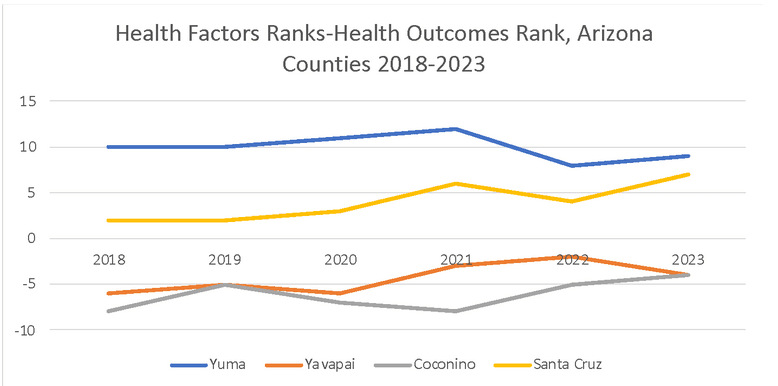
We were concerned that the lockdowns associated with our response to Covid-19 may have destroyed that social support network, but that was not the case. Yuma and Santa Cruz counties still outperformed:
The data compiled in the RWJF in its study on County Health rankings is a landmark beginning for investigations into what constitutes “health.” While it is true that in order to improve the health of a community, improving all aspects of health (Health Behaviors, Clinical Care, Social and Economic Factors and Physical Environment) will be helpful, it is equally clear that some efforts will be more productive than others. In a situation of limited resources, it is imperative that those resources be utilized wisely so the maximum improvement for the maximum population will be possible.
This analysis points out that this is not always intuitive. While the Spearman rho statistic for testing linear association of ordinal level data indicate a moderately strong relationship between Health Factor Rankings and Health Outcome Rankings, the Consonance Comparison in Arizona suggests complexity in this relationship with notable non-linear relationships. Specifically, the outlier counties found on both extremes (Yuma much better outcome than expected based on its Factor Ranking; Yavapai much worse than expected based on its Factor Ranking) may have a more important implication than the trends found in the linear analysis. A conventional analytical approach based on linear relationships is not appropriate to understand what is, likely, a complex relationship.
In a follow-up study, we postulated the “something else” was the so-called Hispanic Paradox in which, much like the Roseto Effect, the robust social support network modifies the effect of Health Factors on Health Outcomes. The Health Factors is the substrate on which the “something else” (x) works to produce the Health Outcomes:
Health Outcomes = x (Health Factors)
This is highly significant for several reasons. In the first place, improving Health Factors may be extremely expensive or, in some cases such as geographical factors, impossible to replicate or improve. Secondly, since it is multiplicative and not additive, changing the x in the equation gives a nonlinear result. Small changes can have large effects. Finally, using the County Health Rankings & Roadmaps to rapidly identify counties in which the Health Outcomes outperform their Health Factors provides a screening tool for further analysis.
In the case of Arizona, the “something else” is the Hispanic Paradox produced by the robust social support system but in other instances, it may be other causes. Positive Deviance can be used to identify likely other possible avenues to explore for a similar “something else.” These elements can behave like Dark Matter in Healthcare. They may not be fully identified as yet, but we can observe their effect.
Join the Conversation
Published under a Creative Commons Attribution 4.0 International License
For reprints, please set the canonical link back to the original Brownstone Institute Article and Author.