
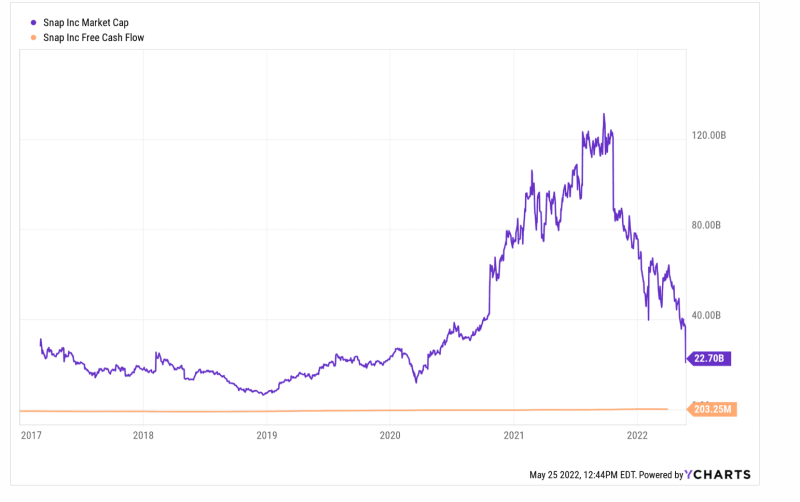
Things are starting to snap left and right—yesterday’s 43% plunge by Snap Inc. (SNAP) being among them.
Then again when a company’s market cap drops 85% in eight months, after having erupted by 815% during the previous year-and-one-half, it’s likely that something isn’t on the level. In this case, the starting date is foremost among the suspects.
It happens that SNAP’s market cap stood at just $14.3 billion in March 2020 when the Fed commenced its most insane money printing spree ever. A mere 18 months later SNAP’s market cap weighed in at $131 billion, and we do mean for no rational fundamental reason whatsoever.
At that point its LTM revenue and free cash flow stood at $3.7 billion and -$6.0 million, respectively. That amounted to a 35X revenue multiple and infinite valuation of free cash flow (yellow line), of which the company had reported a red ink version continuously since going public in late 2016.
Still, it’s hard to say that the company’s profits warning and breath-taking plunge yesterday ushered in a return to sanity. In fact, its LTM free cash flow posted at just $203 million in March, meaning that at the peak last fall it was valued at 645X current free cash flow, and still—yesterday’s flame-out notwithstanding—clocks in at 111X.
In other words, the Fed’s money-printing madness after March 2020, unleashed to fund lockdown interventions, suffocated whatever semblance of rationality that remained in the financial markets. So now, in the absence of a red hot printing press at the Eccles Building, when untethered valuations are struck by mundane realities bloodbaths like yesterday’s Snap Inc. implosion are becoming an increasingly frequent occurrence .
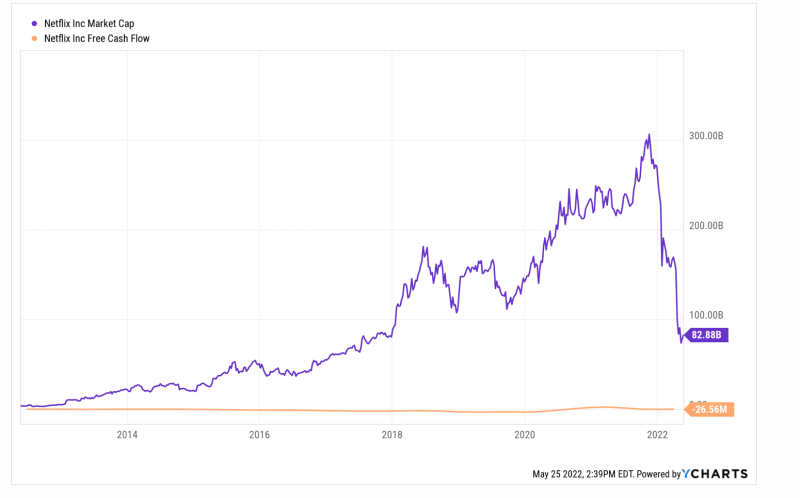
To wit, the recent plunge of Netflix is simply another case in point. It’s market cap has shrunk from a peak of $305 billion last November 16th to $82 billion at present—a plunge of 73%.
The thing is, Netflix’s peak market cap was sheer madness. At the time its LTM free cash flow was $151 million, implying a multiple of 202X. Even if you credit its best ever free cash flow of $2.46 billion posted for the March 2021 LTM period, the implied multiple was a ridiculous 124X.
At present, of course, its free cash flow has reverted to the company’s historic red ink pattern, posting at -$26 million for the March LTM period.
So it’s still not clear whether the company’s valuation has been normalized or not, but one thing is certain: The $223 billion loss of market capitalization during the last six months did not happen in a vacuum. Losses of this magnitude and suddenness, repeated by the scores, will impact the behavior of speculators and bubble-riders across the length and breadth of the financial markets, and not in a good way.
In fact, that’s the essential sin of the Fed’s money-pumping madness. It caused irrational speculation on the way up, and now that the Fed has been forced into a belated inflation-fighting campaign, will precipitate endless plunges and dislocations on the way down.
Moreover, that prospect is not just limited to the financial markets or the red hot go-go stocks. And it’s not just a matter of easy-come-easy-go wealth going up in smoke. The real economy will get hammered, too.
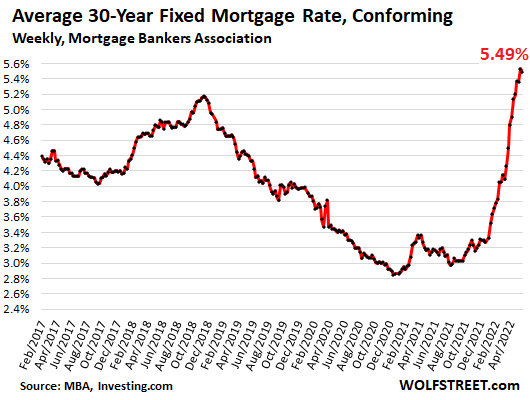
For example, the recent explosion and then collapse of volumes in the mortgage refi market is a good example of the main street impact of the Fed’s policy reversal, which has now raised the 30-year mortgage rate by 270 basis points.
Back when the post-crisis expansion was getting long-in-the-tooth, the trend level of home mortgage refi’s averaged $171 billion and $121 billion per quarter during 2017 and 2018, respectively. But as shown in the sequence below, when the Fed opened up the money-spigots in September 2019, and then with malice aforethought in March 2020, all hell broke loose.
Compared to the $140 billion level in Q2 2019, mortgage refi activity shot the moon, peaking at $726 billion in Q2 2021. That represented a level roughly five times the normal rate, meaning that millions of mortgage were refinanced in a sudden surge, and at rock bottom interest rates.
Quarterly Volume Of Home Mortgage Refi’s:
- Q2 2019:$140B;
- Q3 2019: $211B;
- Q4 2019:$366B;
- Q1 2020: $346B;
- Q2 2020: $502B;
- Q3 2020:$620B;
- Q4 2020:$694B;
- Q1 2021: $709B;
- Q2 2021: $726B;
- Q3 2021:$583B;
- Q4 2021: $498B;
- Q1 2022: $424B
The downside is now underway. Refi volume was down 42% in Q1 2022 and the Fed is just getting started in its interest rate raising campaign. In fact, as of mid-March the Fed funds rate was still essentially zero.
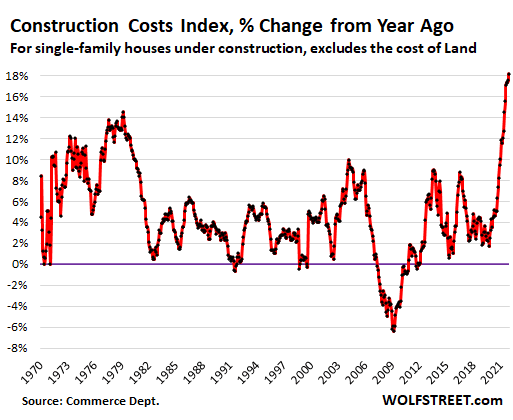
Going forward, the impacts of rising rates and plummeting mortgage originations will be multitudinous. For one thing, the huge home price increases of the past two years will not be rolling over suddenly and easily to clear the markets in classic fashion because new housing supply is being sharply curtailed by soaring material and labor costs.
Indeed, there is massive supply-side inflation in almost everything involved in building a home, with the home construction index up by 18% from year ago levels, and outright limits on availability of some items regardless of price. That trend is not reversing any time soon and could get worse depending on energy prices and Chinese lock downs.
Meanwhile, all those would-be buyers squeezed out of the ownership market will have to rent. Nor is the squeeze merely marginal. In April 2021, for example, 25% of new-home sales were priced below $300,000, reflecting first time and lower income buyers. By 2022, however, only 10% of new home sales were under $300,000.
The rapidly intensifying squeeze in the ownership market, in turn, will push up rents, which are already rising by upwards of 20% on a Y/Y basis according to private tracking firms.
Given the fact that direct rents and indirect rents (i.e. owners equivalent rents) account for 32% of the weight in the CPI, it is evident that the 8.3% headline CPI rate is not coming down any time soon. That means the Fed will have no escape route from pressing interest rates steadily higher.
Likewise, the impending collapse of the refi market will not leave the allegedly “strong” consumer unaffected. The huge one-time reduction in mortgage servicing costs embedded in the 2020-2021 refi figures above opened up the PCE spigot proportionately.
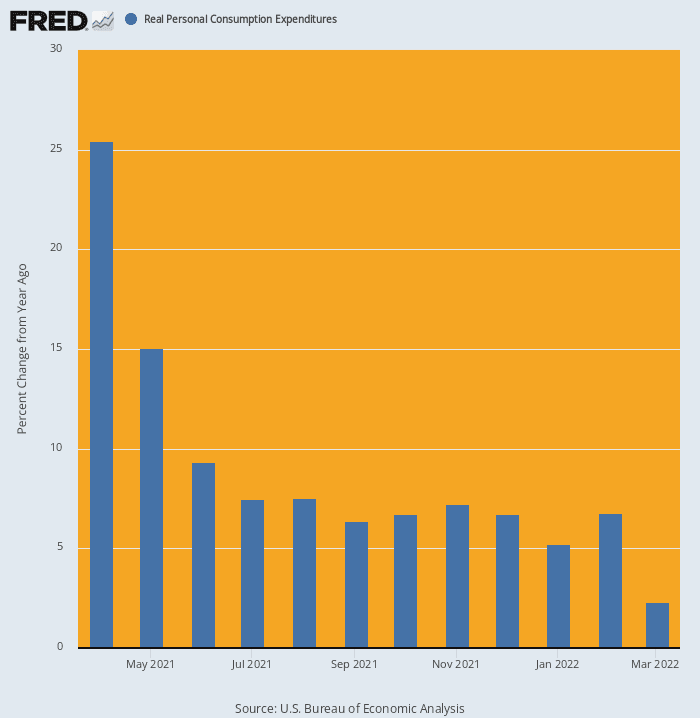
In fact, when the refi effect was combined with the $1.9 trillion Biden stimmy round last spring, household spending went into low earth orbit. It rose by 25.4% on a Y/Y basis in April and remained at elevated levels through year-end.
But by March 2022 the momentum had already sharply abated. Household spending, in fact, was only 2.3% higher than prior year, and is clearly heading for a negative number in April and beyond.
Y/Y Change In Real PCE, April 2020-March 2022
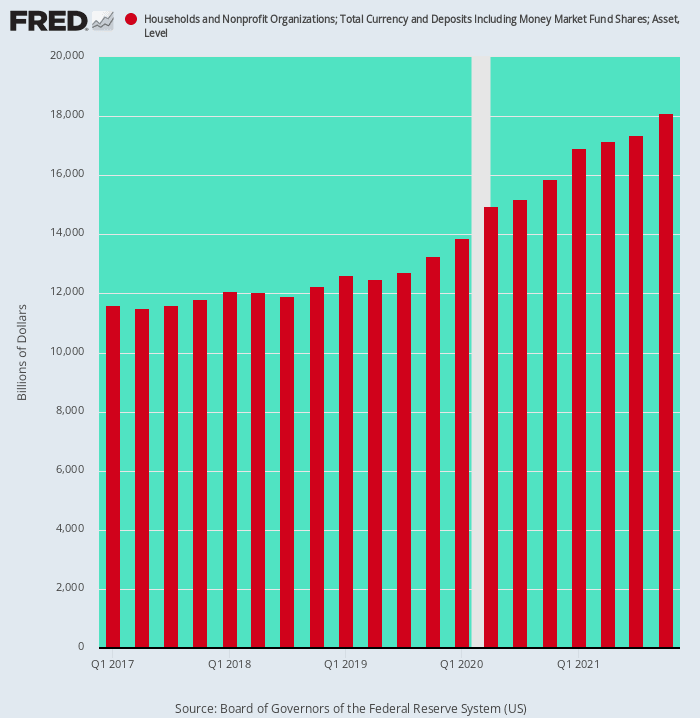
Finally, it should also be noted that the massive build-up of household cash deposits owing to the stimmies and forced spending cutbacks compliments of the Virus Patrol was also a one-time event. Thus, during the two-years ending in Q4 2019, household cash deposits rose by $1.45 trillion, representing the trend rate of the last decade.
But owing to the bacchanalia of post-Covid monetary and fiscal stimmies, cash deposits soared by $4.84 trillion or by 3.3X the prior trend rate between Q4 2019 and Q4 2021
Needless to say, these windfalls sharply boosted the capacity and incentive to spend, but that prop under the “strong” consumer is about ready to vanish as well. Going forward, these unusual cash balances will be actually diminishing, rather than increasing wildly, thereby providing another trap-door under the main street economy.
Household Cash Balances, Q1 2017-Q4 2021
In short, both the Wall Street and main street economies have been so badly roiled and distorted by lockdowns, the Fed’s money-printing spree, and Washington’s stimmy paloozas that a lot of stuff is going to “snap” as the Fed is forced into a desperate inflation-fighting mode.
What that means in practical terms is that current economic numbers, like SNAP’s market cap, are a here-today-gone-tomorrow affair. The rear-view mirror, in fact, is a reliable guide to little more than what SNAP shareholders experienced yesterday—-a very rude awakening.
Reposted from the author’s page.
Join the Conversation
Published under a Creative Commons Attribution 4.0 International License
For reprints, please set the canonical link back to the original Brownstone Institute Article and Author.