Reports and videos of the smoke and haze from the intense wildfires enveloping Canada and drifting down south into the US bring back vivid memories of Australia’s two-month long bushfires (in the Australian vernacular: Canberra is the country’s bush capital) three and a half years ago and floods last year. And so does the claim that the fires and floods validate the apocalyptic warnings and the ensuing impassioned debate over how much this is evidence of a climate emergency owing to anthropogenic global warming.
UN Secretary-General António Guterres warned on 23 March that the damage from climate change is making the planet “uninhabitable.” The environment is breaking down, with consequences that include intensifying heatwaves, droughts, floods, wildfires, and famines. Others add forced migration and wars to the downstream consequences to heighten the panic porn.
This is why, Guterres urges, 2023 should be the year of “transformation, not tinkering.” Instead, governments remain trapped in incremental measures. Consequently, Guterres repeated on 15 June: “We are hurtling towards disaster, eyes wide open … It’s time to wake up and step up.”
Whoa! Time out for a reality check.
Scientific uncertainty
To start with, as has been the case for three years in relation to Covid, the emphasis on scientific consensus reformulated into The Science™ engages in the strategy of suppression-by-denial of uncertainties and contestation of the gravity and urgency of the threats faced, the causal pathways and relative weightings of the different drivers that influence climate change in a timeframe of millennia, and the mix of alternative policy interventions like adaptation and mitigation to address the challenge.
The complexity of climate systems is due to nonlinear equations involving many different variables across time on land, sea, and air, as well as the interactive linkages among multiple subsystems like the atmosphere, oceans, glacier ice, permafrost, land surface, etc.
The relative potency of the different drivers of climate change variability—such as CO2 emissions, solar variability, ocean circulation patterns, volcanic eruptions, and Milankovitch cycles of planetary orbital variations—is not known with any degree of precision. Geological records show that warming and cooling periods go through extended cycles with no apparent pattern to the intensity, severity, and timing of the cycles.
In my previous article, I had argued that Covid-19 is a serious but not an existential global health crisis. Similarly, it is possible to question the extent of the contribution of fossil fuels to climate change without necessarily denying that it does so. The uncertainties and contentions lie in the all too crucial details. In an article last year in Health Physics, three scientists from the University of Massachusetts Lowell challenged the thesis that most of the increase in CO2 atmospheric concentration since 1850 has been from the anthropogenic fossil fuel component. They found that from 1750 to 2018, “the percentage of the total CO2 due to the use of fossil fuels … increased from 0% in 1750 to 12% in 2018, much too low to be the cause of global warming.”
Empirical data contradicts catastrophising models and claims
Second, and again as with Covid, observational data can also be at variance with climate model predictions. The mathematical precision of the latter hides the reality of assumptions inputted into the models by bias-confirming humans which determine the scenarios that are produced. In a previous article, I listed several predictions that have already been falsified, thereby satisfying Karl Popper’s criterion for pseudoscience.
A reconstruction for southeast Greenland showed that temperatures have risen and fallen since 1796. If rising CO2 concentrations are a driver of Arctic warming, the 19th and 20th centuries should have been noticeably colder than today. Instead, the study found there were warming and cooling episodes throughout 1796–2013; decadal periods in the 1800s were occasionally warmer than in 2013; and there was more sustained warming in the 1920s and 1940s than during the 21st century.
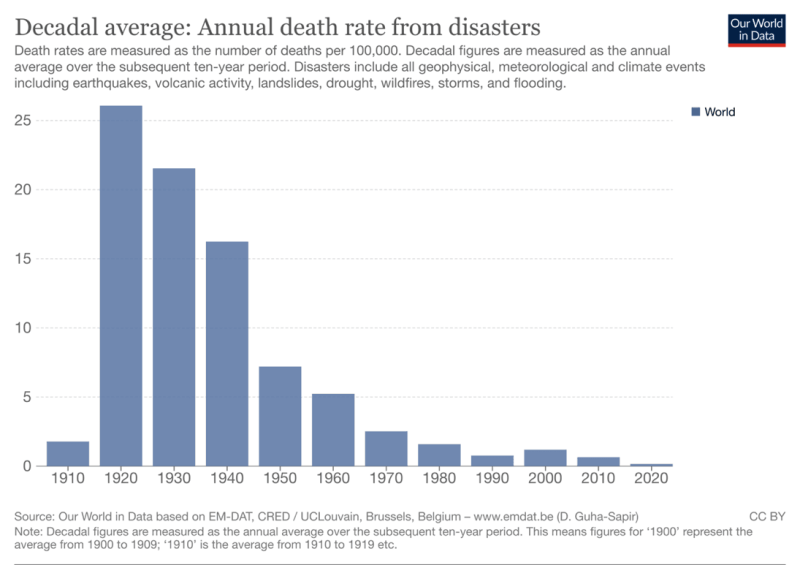
Figure 1: The global annual death rate from all natural disasters
Similarly, an article in European Geosciences Union on 16 May by three climate scientists from Leeds University noted that from 2009–19, a reduction in the area of ice sheet on the Antarctic Peninsula and West Antarctica has been outweighed by area growth in East Antarctica and the large Ross and Ronne-Filchner ice shelves, for a net increase of over 5,000 square km. Some ask if, instead of a continuous rise in temperatures, there is not a limit to the heating effect from CO2 emissions on the atmosphere, not unlike evidence that the virus infection rate had its own natural limit after which it peaked and fell rather than climbing infinitely. Others speculate that there may be natural self-healing mechanisms to check uncontrolled climate extremes that keep the earth in balance over long cycles of history.
The recent Canadian wildfires, with the heavy smoke blanketing huge areas of the US as well, generated more catastrophising hysteria than light, just like the bushfires in Australia in the 2019–20 summer. The instant blame game points the finger at climate inaction. At 6:37 in the morning of 8 June, President Joe Biden tweeted that Canada’s “record wildfires … are intensifying because of the climate crisis.”
Prime Minister Justin Trudeau followed at 9:21: Canada is experiencing “more and more of these fires because of climate change.” And these are the guys who want to establish government mis- and dis-information boards? Their apparently irresistible urge to catastrophise ignores the inconvenient data that the mortality impact of all-cause natural disasters has experienced a steep decline since the 1920s-40s (Figure 1).
The Netherlands-based Clintel Foundation published a paper on 9 May arguing that the IPCC’s Sixth Assessment Report ignored peer-reviewed literature which shows disaster losses have decreased since 1990 and that the death toll from extreme weather has fallen by 95 percent (!) since 1920: “The strategy of the IPCC seems to be to hide any good news about climate change and hype anything bad.” The disaster-addicted panel needs to invite a broader range of views inside its deliberations tent, they advise.
Yet another mostly ignored reality is that emissions from forest fires are much higher than the reductions resulting from government regulation. Research from University of California experts last year found that wildfire emissions in just one year in 2020 were twice as high as the state’s greenhouse gas reductions from 2003 to 2019. Another study found that in 2021, emissions from burning boreal forests in North America and Eurasia were almost double that from aviation fuel.
This means that reducing fuel loads (the dry, combustible wood that builds up on forest floors) that have accumulated owing to poor forest management is the better emission reduction strategy than focussing solely on fossil fuel reduction. Pressure from environmental activists to focus more on reactive fire suppression rather than proactive fire prevention strategies is harmful to long-term emissions control. That is, prescribed burns that clear out the debris on forest floors could reduce CO2 emissions by more than mandating offshore wind farms and EV automobiles.
As we saw with Covid, the data is often cherry-picked around the narrative, in particular the temporal benchmarks. If we look at the acreage burned in the US over the last 30 years, for example, there is a visually dramatic increase from just under three to around ten million acres per year. However, it has fallen steeply from a high of over 50 million acres per year since the 1920s.
The situation in Canada too is similar. According to a study by the Fraser Institute of trends, in the 1959–2019 period, “there was a sharp increase in destruction caused by forest fires in the first half of this period, and a general decline in the second half.” Around 7.6 million hectares were burned at peak in 1989, falling to 1.8 million hectares in 2019. The Globe and Mail’s editorial board argued on 26 July 2021 that prescribed burns improve a forest’s overall health while fire suppression leads to “forests susceptible to massive blazes” from the kindling deadfall on the floor.
Debating bushfires and floods down under
Sydney was smothered in thick choking smoke that burning summer. Smoke from surrounding fires—from our house we could see the flames licking the sky just beyond the airport—gave Canberra the world’s worst air quality index of 4,758 on 1 January 2020, more than twenty times above the official hazardous threshold of 200. Yet, Canberra’s hottest day on record that month at 440C was no more proof of the scientific reality of global warming than Delhi’s coldest December day on record (30th) was a refutation of it.
Amidst the blackened skies and burning landscapes of Australia’s many fires that southern summer, the lazy response from some, for example the editorial board of the Financial Times, was to blame climate denialism for the natural disaster. Prime Minister Scott Morrison was sharply criticized for climate delinquency.
Although localized anger from the bushfire victims was understandable, much of the broader critique was misplaced. It showed wilful ignorance of Australia’s bushfire-prone history, downplayed the responsibility of state governments for prudent forest management practices, overlooked the long lead times between emissions and climate change, sidestepped the weak links between global warming and specific weather events, and exaggerated Australia’s impact on global temperatures.
Which one of these doesn’t find an echo in North America at the moment?
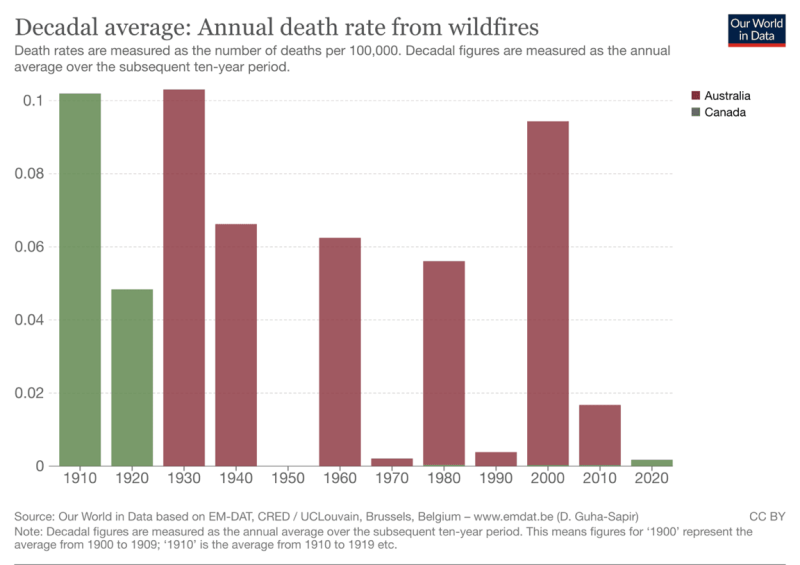
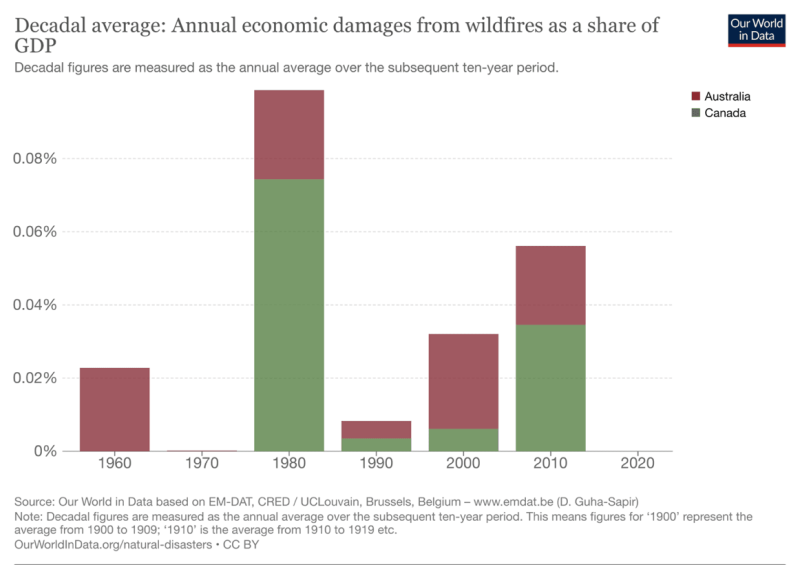
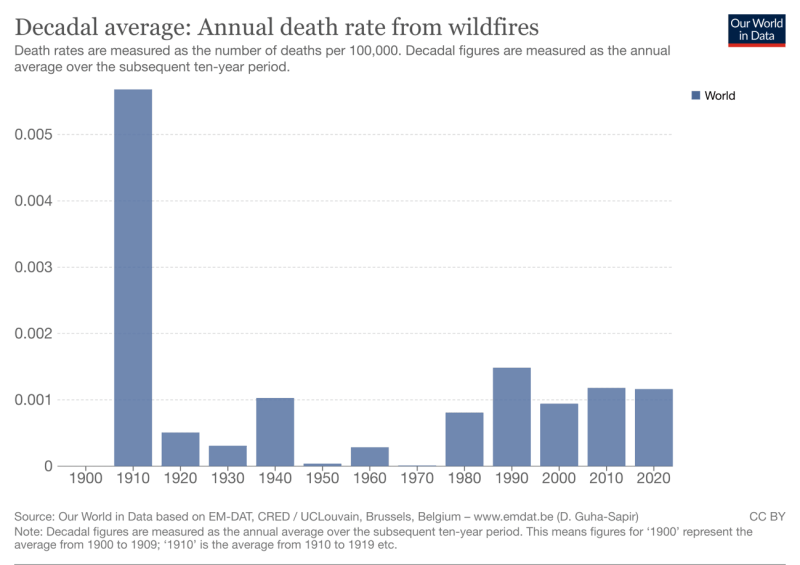
Yet the reality is that the wildfire hazard has become less serious in both countries (Figure 2).
Aboriginal communities have lived in Australia’s harsh climate and terrain for tens of thousands of years. Recent research has documented the sophisticated system of land and bush management practices they employed to sustain and regenerate forests. The use of fire was an important part of this cycle.
The UK Met Office published a perusal of 57 peer-reviewed scientific papers which noted that fire weather translates to fire activity only with natural or human ignitions (lightning, arson, carelessness) and “burned area is insensitive to fire weather in regions [including Australia] where fuel stocks or human suppression are the key fire limitations.”
Figure 2: The annual rates of deaths and economic damage from wildfires in Australia and Canada, 1910–2020
In a complementary brief, a Technical Report in 2015 from the Commonwealth Scientific and Industrial Research Organisation, the Australian government’s peak scientific research body, noted that at any given place, fire potential depends on four “switches:”
- Ignition, either human-caused or from natural sources such as lightning;
- Fuel abundance or load (a sufficient amount of fuel must be present);
- Fuel dryness, where lower moisture contents are required for fire; and
- Suitable weather conditions for fire spread, generally hot, dry and windy.
Queensland-based fire researcher Christine Finlay has long warned that reduced burning of fuel loads during the winter could increase the frequency of firestorms in the summer. Finlay, who studied the history of bushfires from 1881 to 1981 for her PhD, shows that bushfire-reduction operations since 1919 have been departing from traditional indigenous practices such as low-intensity cool-weather burning. And, according to her data, there is a direct correlation between the increased frequency and size of fires since 1919 and the accumulation of catastrophic levels of fuel load.
Controlled burning – which is conducted over large areas and under favourable wind and temperature conditions – is cheap and highly effective in reducing the incidence of bushfires as well as the likelihood that they will spread uncontrollably. And, unlike drastic efforts to reduce GHG emissions, it does not threaten livelihoods and living standards.
Bushfires have both structural and direct causes. Australia’s average surface temperatures have increased by about 1.50C since the early 1900s. In a continent dominated by dry eucalypt landscape and hot temperatures, anthropogenic global warming might have aggravated the background conditions for fires to occur more readily, more often, in more places and for the fire season to last longer.
However, local weather patterns are little determined by complex and dynamic global variables and current emissions will influence climate conditions decades into the future, not this year or next year. The most authoritative international report only shows weak links between human-induced climate change and droughts, bushfires, floods, and hurricanes. If Australia had achieved net carbon neutrality by 2019, that would have made no difference to that season’s fires.
There are some things the Australian federal and state governments can do now and on their own to reduce the fire toll. Fire management authorities identify the direct causes of individual fires as arson, careless use of fire, lightning, etc. Arsonists must be apprehended and prosecuted and the public better educated on the risks.
Climate alarmism got a second life a year later as massive floods hit eastern Australia. We moved to the Northern Rivers region of New South Wales in December 2021, just in time to be greeted in our new home by the floods as the whole area was badly flooded in February–March 2022. Again, however, not for nothing is Australia known as the land of droughts, fires, and floods and, contrary to the trap of ahistorical presentism into which most media commentary fell, the death rates from periodic floods have not risen hugely over the decades (Figure 3). However, the economic damage has worsened and this probably reflects rising prosperity with more expensive farms and dwellings than in earlier times. A major contributory factor to the floods also is the unfortunate history of granting planning permission for residential developments in floodplains.
Yet, like the different metrics regarding wildfires, with floods also one can pick the area flooded, the number of people killed, or the scale of the property, crop, livestock and economic losses, and the per capita vs. aggregate statistics.
Figure 3: Floods in Australia—Decadal average: Annual death rate and economic damage as a share of GDP (percent)
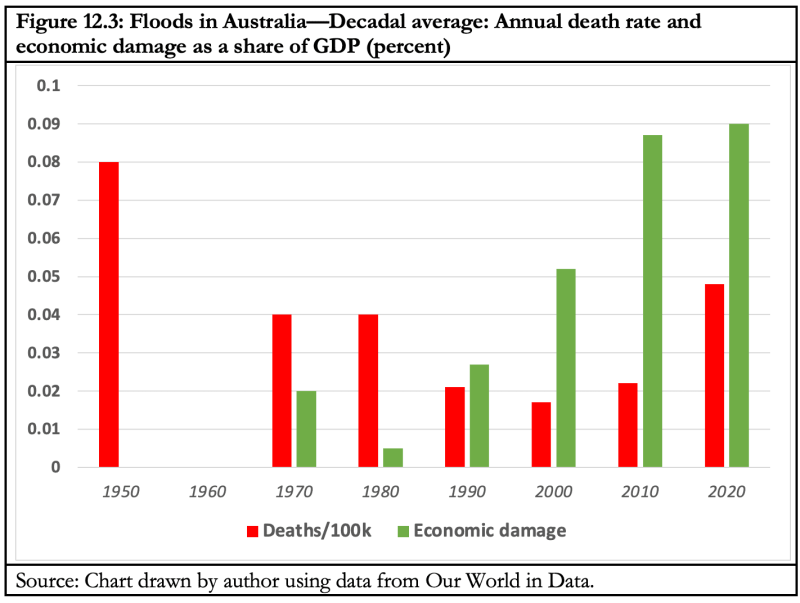
Source: Chart drawn by author using data from Our World in Data.
The deadliest natural disasters are not related to climate change
However, conflating man-made global warming with weather disasters betrays willful ignorance of Australia’s long history of bushfires. There have been several deadlier heatwaves and fires in Australia’s short history even since European settlement, for example in January 1896 with 200 deaths across Australia in three weeks, and again in January 1939 with 71 deaths in the state of Victoria.
The third echo of Covid is in the way it falls into the trap of prioritising climate action to the neglect of other public policy goals and the cost-benefit calculation is reduced to shouting slogans which, if questioned, degenerate swiftly into abuse and demands for cancellation. In both cases, pressures to intellectual conformism and restrictions on freedom of expression and scientific inquiry in questioning the prevailing “progressive” benchmarks corrupt science into a cult. Why is it illegitimate, immoral, and positively evil to be reluctant to cut back on comfortable lifestyles in the high income countries and aspire to the same in the poorer countries, that have been made possible and will be easier, respectively, by fossil fuel energy use?
Figure 4: Annual global death rates from wildfires and earthquakes, 1900–2020
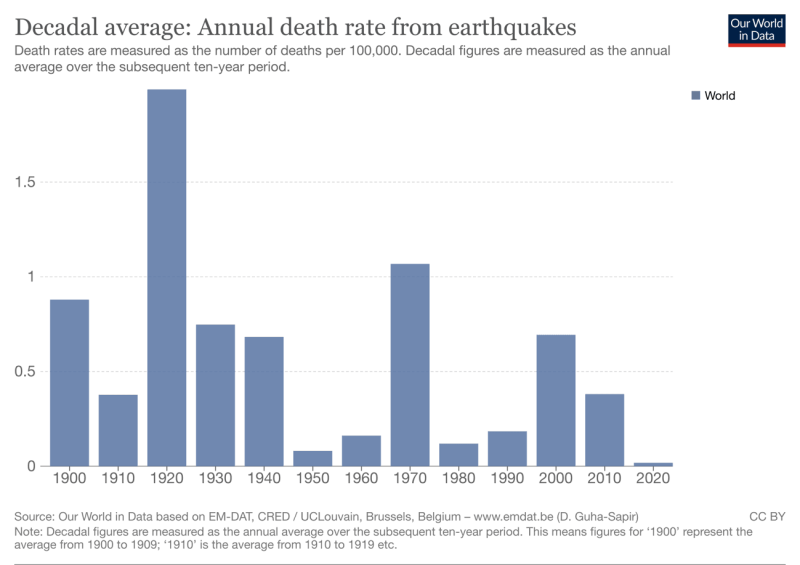
Some of the worst ‘natural’ disasters resulted from human decisions. The primary blame for the Ukrainian famine of 1932–33 that killed 13 percent of the population lay with Stalin’s policies. Similarly, Mao Zedong’s ideologically-driven farming policies contributed to the great China famine in 1959–61 that killed tens of millions. In recent decades the natural disasters with the worst mortality impacts have been earthquakes and tsunamis (as on Boxing Day 2004 in the Indian Ocean that killed a quarter million people) which are not related to climate change.
In my living memory the worst drought that caused widespread famine in Bihar, my home state, (and in the eastern districts of adjacent Uttar Pradesh) was in 1966–67. The national grain production fell by one-fifth. Bihar’s annual grain production declined from 7.5 million tonnes in 1964–65 to 4.3 million in 1966–67, causing a steep rise in the price of essential foods. I recall driving through unfamiliar countryside and striking up a conversation with some local farmers. When we inquired about how they were faring, they said they had hardly had any rain since the late first Prime Minister Jawaharlal Nehru’s ashes had been scattered over the countryside as per his requests (in 1964).
The last really big famine in India as a whole was the great Bengal famine of 1943, in which, according to Nobel Laureate Amartya Sen’s calculations, nearly three million of Bengal’s 60 million people died over 3-4 years (Poverty and Famine: An Essay on Entitlement and Deprivation, 1981, chapter 6, “The Great Bengal Famine,” p. 52).
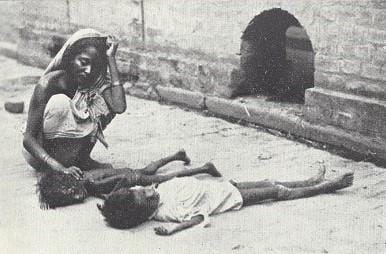
Source: “Dead or dying children in a Calcutta Street,” The Statesman, Calcutta, 22 August 1943 (public domain).
Madhushree Mukherjee in her 2010 book Churchill’s Secret War: The British Empire and the Ravaging of India during World War II, blames Winston Churchill for aggravating the severity of the famine by rejecting pleas from British officials governing Bengal to unload Australian wheat in Calcutta. Churchill insisted it must all go to British troops in Europe. Opposition parliamentarian Shashi Tharoor (a friend and colleague from UN days) and author of Inglorious Empire: What the British Did to India (2017), sharply criticised the celebration of the British wartime leader in the 2017 film Churchill.
Extreme cold is far, far deadlier than extreme heat
According to a 2014 study by the CDC, around 2,000 US residents died each year from 2006–10 from weather-related events: respectively, 63, 31 and 6 percent from cold, heat, and floods, storms, and lightning. In 2021, a team from Monash University in Australia published the findings of the world’s largest 45-country study spanning five continents on climate-related mortality from 2000–2019 in Planetary Health, a Lancet journal. Of the 5.1 million annual deaths from extreme temperatures (9.4 percent of all global deaths), 90.4 percent died from cold.
Figure 5: Cold weather dominates extreme weather-related mortality around the world
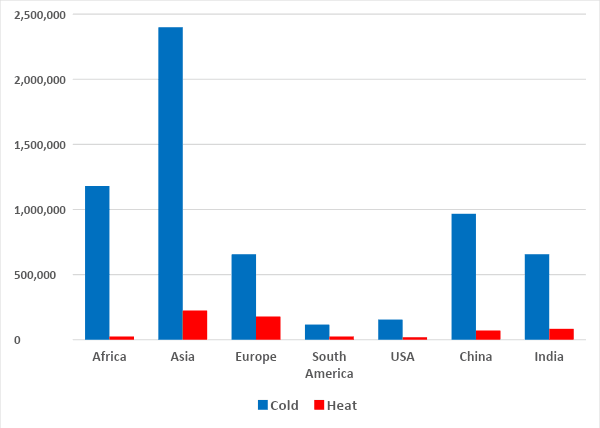
Source: Drawn by author from data in Qi Zhao, et al., “Global, regional, and national burden of mortality associated with non-optimal ambient temperatures from 2000 to 2019: a three-stage modelling study,” Planetary Health 5:7 (July 2021).
Yet the press release from Monash spruiked the study, honed in on rising deaths from heat over the period, and linked it to a 0.260C rise in temperatures per decade. This despite the fact that cold-related deaths had fallen by 0.51 percent and heat-related deaths had risen by 0.21 percent, representing a big net fall of 0.3 percent (15,200) in total weather-related annual deaths. Unsurprisingly, the Guardian headline also took the doomsayer approach: “Extreme temperatures kill 5 million people a year with heat-related deaths rising, study finds.”
The Economist ran a story on 10 May that “expensive energy may have killed more Europeans [68,000] than Covid-19 last year.” As with Covid, the brunt of climate action pain is borne by the poor and working-class people. Speaking of Covid, as if damage from prolonged school closures and mask and vaccine mandates wasn’t enough, 3,000 teachers in Oakland, California went on strike recently demanding climate justice. Thanks to alarmist teaching in schools, more than half of British teenagers are convinced the world will probably end during their lifetime.
The limited impact of Australian and Canadian action on climate change
Figure 6
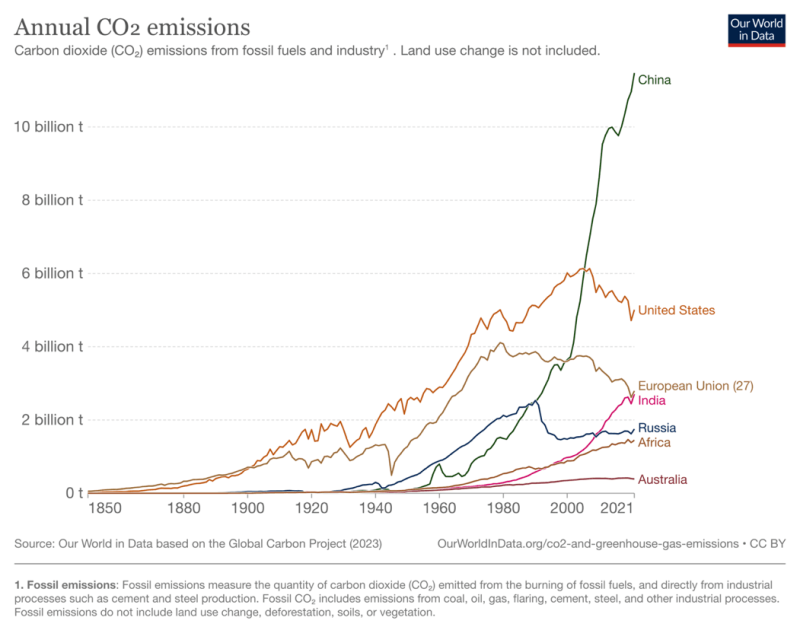
Climate action to lower the risks of bushfires can only be done globally. With between 1-1.4 percent of world CO2 emissions, Australia and Canada’s direct climate impact for good and bad is limited. The big four emitters are China, the US, India, and Russia, in that order, accounting for nearly 60 percent of global emissions.
Advanced modern economies like Australia and the US have far better disaster preparedness infrastructure and skills and can limit the deadly toll more effectively than developing countries. Energy was a critical component of their industrialisation that today gives them such capacity.
Table 1: Changing share of annual CO2 emissions, 1850–2021 (percent)
| Country/Region | 1850 | 1900 | 1950 | 1985 | 2021 |
| Africa | 0.0 | 0.1 | 1.6 | 3.3 | 3.9 |
| China | 0.0 | 0.0 | 1.3 | 9.8 | 30.9 |
| EU-27 | 27.5 | 36.5 | 21.3 | 18.8 | 7.5 |
| India | 0.0 | 0.6 | 1.0 | 2.0 | 7.3 |
| USA | 10.0 | 33.9 | 42.3 | 22.9 | 13.5 |
Source: Our World in Data.
Figure 7
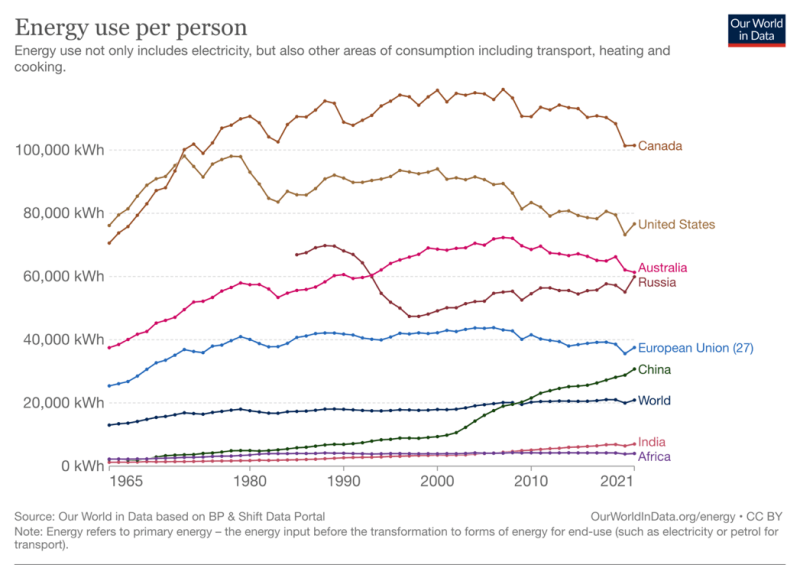
Figure 8
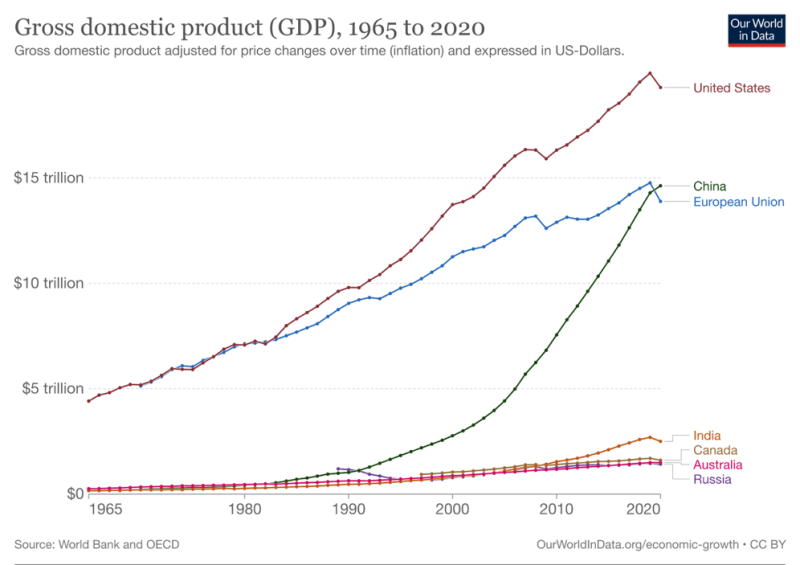
For developing countries, disaster preparedness requires transitioning to a modern economy, for which industrialisation is necessary. Industrialisation requires greater energy intensity to build high-quality dwelling, transportation, public health, and education infrastructures. Figures 7 and 8 show the correlation between energy consumption and GDP growth. India’s annual per capita energy consumption is only one-third the world average; Americans, Australians, and Canadians use between 9 to 15 times as much electricity per person. This explains the apparent paradox that the share of the industrial economies is significantly higher in the cumulative total of emissions even though China and India are among today’s big emitters (Figure 9).
Figure 9
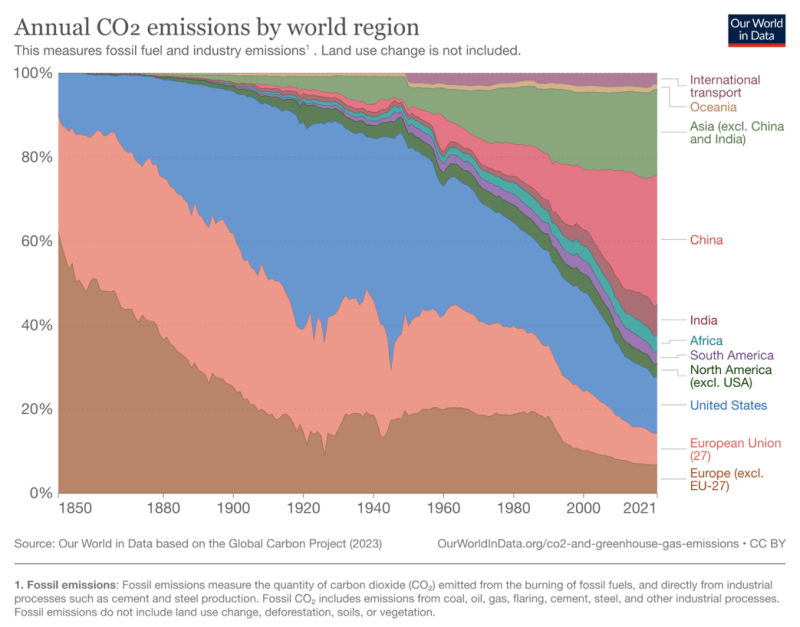
A country’s growing intensity of energy use as it industrialises explains why cutbacks to the emission limits of developing countries require longer lead times and global climate agreements have reflected the different treatments of industrialised and developing countries. Such nuances are difficult to explain to a wider public not very interested in blame-shifting for historical and per capita emissions. They see that aggregate emissions from China and India are 34 and 7 times more than Australia’s, respectively, and refuse to back tougher emission cuts by Australia.
The tide may be turning against climate alarmism
Fossil-fuel-based energy provided the power for the explosive liftoff of the masses from the subsistence lifestyle that had condemned them to nasty, brutish, and short lives. Mimicking the surge in the growth of the democratisation of access to education, health, and improving family finances with successive generations, China, India, and other parts of the non-Western world have adopted, in accelerated overdrive if possible, the strategies of the Industrial Revolution to break free from their own misery-ridden lives.
We saw in the Covid era a restoration of the feudal world of class division between the Zooming laptop class and the working-class deplorables. Part of that was the hypocrisy of the ruling class, who brazenly flouted the very rules they imposed on everyone else, mingling merrily, sans masks, with partygoers from the world of financial, political, and cultural privileges, even while the serving staff were compelled to wear masks as a condition of their employment.
Similarly, the Davos crowd flies into their jamborees on private jets and are chauffeured around in gas-guzzling limousines when they assemble annually to hector us deplorables to abandon our cars and flights. In May, a Briefing Paper from the World Economic Forum advocated for a 75 percent reduction of automobiles by 2050.
Against the weight of the folly of serially repeating historical evidence on picking winners, governments seem determined to coerce citizens out of reliance on existing cars into dependence on electric vehicles. Inevitably, because the market is unable to incentivise the switch to EVs, generous public subsidies have been offered. Who can be confident of the relative subsidies to Big Oil and Big Green, or the money flowing from them to fund climate denialism vs. climate alarmism?
EVs experienced a series of bad car days recently in the UK: their resale value has been dropping twice as fast as petrol cars; the number of free chargers dropped by nearly 40 percent because soaring energy costs made them uneconomic; and the one-third heavier battery weight means some bridges and upper-storey parking lots, including in apartment complexes, could collapse under the strain of too many cars.
To cap it all, the brilliant comedic actor Rowan Atkinson of Blackadder, Mr. Bean and Johnny English fame, wrote in The Guardian on 3 June that he feels he was duped into buying electric. Unbeknownst to most of us, he has an electrical engineering degree and owns a fleet of cars. If we measure emissions at the end of the exhaust pipe, EVs are super. If, however, we look at the life cycle of cars, from all the components (for example, nickel) to the manufacturing process, the mix of fuels producing electricity, the impact of the heavier batteries and bigger tyres, and the waste disposal of all the bits and parts, then not so much. Keeping the petrol car for a few years more may be a more climate-friendly choice.
While the West is wedded to the fantasy Net Zero target and sin bins coal as a four-letter word, China’s CO2 emissions increased by 4 percent in the first quarter of 2023 compared to last year. Meanwhile Britain fired up coal plants after a recent heatwave made the solar panels too hot to work efficiently! Furthermore, as the fossil fuel share of energy generation falls, the claim that renewables can supply power on a reliable basis is being exposed as a myth.
Consumers (including yours truly just this week) are getting notices of rapid power price surges to explode the related myth that renewables mean cheaper power. Many American communities are pushing back against the ballooning wind and solar projects scarring rural landscapes. Perhaps Fraser Nelson is right and the tide really is turning against climate alarmism as reality bites ordinary folks.
The Clintel group’s World Climate Declaration, issued by several high profile scientists on 18 February and signed by 1,500 scientists by mid-June, insists that there is no climate emergency. It informs us that warming has natural as well as anthropogenic causes. The rate of increased warming is also slower than predicted by inaccurate climate models. It calls on scientists to be concerned more with science and less with politics to openly address uncertainties and exaggerations in predictions, while urging politicians to weigh costs against imagined benefits and prioritise adaptation strategies based on proven and affordable technologies.
This sure doesn’t sound radical and conspiratorial. But it may prove a step too far for Net Zero politicians who were recently condemned by Alexandra Marshall in the Spectator Australia as “liars, scoundrels and morons.” Aside from that, of course, they are likely to be among the nicest people you will ever meet.
Join the conversation:
Published under a Creative Commons Attribution 4.0 International License
For reprints, please set the canonical link back to the original Brownstone Institute Article and Author.


.jpg)