
For those who may not recall Chicken Little (AKA Henny Penny), the character was derived in the 1880s and was meant to be an allegorical character. Chicken Little was never intended to be the whimsical Disney fantasy character that it became. Chicken Little was infamous for over-exaggerating threats to existence, most notably, with the phrase “the sky is falling.”
As I watched the BBC a couple of days ago, I could not help but notice that the alias of the BBC should be “Chicken Little.”
Of course, you can add ABC, the New York Times, the Washington Post, the Guardian, the Associated Press, NHK (in Japan), PBS, France 24, CBC, CNN, Yahoo, MSNBC, Fox and literally dozens of other mainstream “news” outlets to the list. They all have been Chicken Littles for many years now. People should be adept at recognizing this new media persona.
Remember also that these have been the same news sources who were proclaiming that a common respiratory virus, a coronavirus, was somehow equal to or maybe worse than Ebola. Or that monkeypox was going to be a new scourge on humanity. Or if you step out of your house some terrorist is ready to blow you up. If you eat not enough of this then you could die or if you eat too much of that you could die. I think I could go on but I will leave everyone to their own favorite lists.
These same “News” sources have had no problem in presenting false data, ignoring counterarguments, conducting personal attacks (or firing their own) on those who question their narratives, and so on. These traits alone demand that they be viewed with a heavy dose of skepticism. But, when you add on the alarmist Chicken Little persona, you have something that defies logic. But, that has been recently defined as “Panic Porn,” and maybe aptly so.
According to the BBC, the planet is burning up-they almost literally said as much in the opening of their news segment that I watched last week (ABC was almost identical in its “reporting”). To emphasize the fact that the planet is burning up, the BBC showed the battles against brush fires in Europe, as if these brush fires started spontaneously because the planet is burning up (despite the unreported part that arson has been suspected in many of these fires around the world, from Canada to Europe).
And, the color RED has now been adopted as the panic color, so of course the whole map has RED numbers and/or RED overlay with maybe a lucky place or two in orange or maybe yellow. This despite the fact that most of the RED places are actually experiencing rather NORMAL summer weather for their area. But, normal is no longer acceptable.
They then showed elderly people sitting in their homes in France, without air conditioning, trying to stay cool. Yes, abnormally hot and cold weather do pose the same health risks to the elderly as say, a respiratory virus. That is because the elderly are elderly. It goes with the territory.
Here in Japan, there are daily warnings in the summer for the elderly to take caution because of the heat and humidity (with the same warnings in the winter but due to the cold and snow). In the summer, most ambulance runs are rushing elderly people to the hospital due to heat-related illness. In the winter, the number one source of injury and death comes from elderly people attempting to shovel snow from their roof. Many fall and are killed via accident.
I can attest to the weakening temperature tolerance of the elderly since I am well into my 60s. I could not tolerate some of the conditions that I took for normal growing up and in my young adult days. For example, growing up in Southern California we had summer season daily high temperatures that were almost always over 100 F (38 C) and would last for weeks. We had no air conditioning. At night, the windows would open and we would hope for a breeze to cool the house down to somewhere in the 80s so that we could sleep. I played outside all of the time during those summer months. Oftentimes, I would return home from being out and my mother would scrape the asphalt from the bottoms of my feet because we kids used to run across asphalt streets barefooted and the asphalt was softened and sticky due to the heat. We oftentimes had strength contests such as who could walk across the street the SLOWEST.
At my current age, forget it! I do some things outside for a while and then it is back into the house and I will sit with an ice-cold beer and some air conditioning. Meanwhile, the youngsters are all out there on their bikes and playing sports, etc. Hurray for them!
Is Chicken Little, AKA Mainstream Media, correct? Is the planet burning up?
Let’s examine some of the narratives and see if they hold up to some scrutiny.
Why No Scientist Denies “Climate Change”
The rather ambiguous term, Climate Change, itself states only a known fact.
Fact. All of the Earth’s several climatic zones are dynamic (not static) ecosystems, each in their own way, and they all combine to form the overall natural ecosystem that makes up our planet. Since they are dynamic, they are in a constant state of change.
The tropical rain forests cycle through changes as do the sub-tropics (an area where I live) as do the desert regions, arctic regions, tundra regions, temperate zones, and so on. A changing climate in any of the climatic zones is NORMAL. Virtually every scientist knows and understands that ecosystems are dynamic.
What makes the term “Climate Change” ambiguous is that first of all, there is no such thing as the “Earth’s Climate” and second of all, you need to specifically define what exactly is the change and to what extent are you relating to that change.
Most people have now been brainwashed to think that the term “Climate Change” is the equivalent of the following conclusive assertion (as I have interpreted it in as concise a form as possible and formulated it into an equation):
Climate Change = The planet Earth is experiencing an ecological disaster and existential threat to human life (hence mammalian life) due to planet-wide increases in atmospheric temperatures (i.e. global warming) that is the direct result of greenhouse emissions (e.g. carbon dioxide) that are due primarily to human population growth, technology, and “carelessness/indifference.”
As you can see, there is a rather huge leap from the recognition that our planet experiences dynamic climate fluctuations (real climate change) to the concept of a disastrous, human-induced catastrophe that specifies warming and connections to human produced CO2. In other words, the term has been hijacked and redefined in order to support a narrative.
There is not universal consensus when it comes to the above equation and catastrophic assertions.
Why Weather is NOT the Same as Climate
The Chicken Littles will have you believe that a hot summer day (or series thereof) proves global warming while an unusually cold winter day (or series thereof) proves nothing. You never witness a report that we are in global cooling or heading towards an ice age if many locations on Earth suddenly experience cold weather and blizzards. I am sorry, Chicken Littles, you cannot have it both ways.
As anyone with any sense knows, weather is a local phenomenon. I could be experiencing intense thunderstorms while my friend living only 10 miles away could be experiencing pleasant, cloudless skies. I could be experiencing a brutally hot day while another friend living 30 miles away is experiencing a mild day. During the winter, I could be experiencing a blizzard while another friend is experiencing simply a cold day.
Different climatic zones have different weather trends. For example, the tropics tend to have warm and humid weather conditions year round because, well, it is the tropics. The arctic regions tend to experience cold conditions and deserts can fluctuate between really hot to really cold, all within 24 hours! I will discuss more about what causes these trends below.
Because it is a local phenomena, the extremes of weather, such as hot/cold days, storms, winds, etc. are highly variable and there is little discernible pattern except on the long-term scale. The long-term scale that we tend to use is referred to as “the seasons.” And the seasons are not random but relate to how our planet rotates on its axis (maximal rotational velocity of about 1,000 miles per hour at the equator and almost nothing at the exact poles) and how it revolves around the star which we call the Sun (revolution velocity of about 65,000 miles per hour and an angular tilt of about 23 degrees to the plane of the sun)
Summer/Winter is defined as that period between the two solstice (meaning “sun stop”) periods of summer and winter (when the plane of the sun is in line with either of the two tropics, Capricorn or Cancer) with a peak being when the equator of Earth is in alignment with the Sun (Fall/Spring Equinox).
On our Western calendar, that period falls between the solstice dates of June 21 and December 21 (peaking as equinox on June 21) and defines as Summer in the Northern Hemisphere and Winter in the Southern Hemisphere.
Summer seasons tend to be “warm” and winter seasons tend to be “cold” and the interim seasons, fall and spring shift towards warmer or colder. These trends tend to hold although there may be variations during these seasons.
Immediately, you can see that besides climatic regions, we can add hemispherical/seasonal effects to the planet’s melange of climate.
Within this already huge range of climatic zones there are subzones of atmospheric movement and thermodynamics, which create weather patterns. An example could be the arrival of spring thunderstorms and tornadoes in the middle sections of the US. These weather patterns occur because of the mixing of warm, humid air coming from the tropics (the Gulf of Mexico in the US) colliding with the colder air masses coming from the north. This collision of air masses does not cause one big huge tornado over the whole Midwest; rather, you get localized regions of weather. The reason is that these huge air masses are NOT homogeneous even in themselves.
Many areas may experience a typical spring day while others can experience intense thunderstorms and tornadoes. Perhaps the next day it changes and the storms move on or dissipate. Those local weather patterns are caused by local features of atmospheric conditions, many of which meteorologists still do not fully understand. The reason is that the thermodynamics involved in complex systems can be hard to predict.
I had a house in northern Illinois and during one spring a series of tornadoes passed through my area. One tornado took a path directly towards my house and the local sirens were blazing. But, somehow, that tornado elevated before hitting my house, skipped over, and touched down again about one block past my house. While I had a few moments of some heart-pounding in my basement, I found my house intact so I breathed a sigh of relief and went to bed thinking that the storm had actually dissipated. The next morning on the news, the storm path was shown from a helicopter and sure enough, my house and a few around it were untouched but you could see the path of destruction on other sides. I ran out of the house and saw it for the first time.
That is how weather works.
Why Warm Temperature Does NOT Mean Global Warming
Here is where we start to get into the concept of data collection and interpretation and the reliability or unreliability of data. This is usually where the debate begins with the two basic questions: Where is the data collected and how is it being collected (and reported)?
The thermometer, the instrument that we have for measuring temperature, was invented about 300 years ago. Whether it is a traditional thermometer (one designed on the expansion properties of some known liquid in a specially designed tube) or a more modern thermometer (designed on the electrochemical properties of some material), they mean nothing without some relative scale.
When the first thermometers were developed, three scales of measurement were established and are still in use to this day. Those three scales are the Celsius, Fahrenheit, and Kelvin scales. The Kelvin scale tends to be applied in science while both the Celsius and Fahrenheit scales tend to be used in more common, everyday measurements. All three of the scales have a common reference point, the freezing point of pure water. The Celsius scale defines that temperature as 0, the Fahrenheit scale defines it as 32, and the Kelvin scale defines it as 273.2 (0 on the Kelvin scale is absolute zero, whereby there is no energy output/transfer or motion of atomic or subatomic particles). All three scales can be related via mathematical equations.
For example, F = 9/5 C + 32. Thus, 0 C x 9/5 (= 0) + 32 = 32 F. Or, 100 C (boiling point of water in Celsius) x 9/5 (= 180) + 32 = 212 F (boiling point of water in Fahrenheit).
The first attempts at measuring weather temperatures were started in the late 1800s as an attempt at some form of weather forecasting. Gradually, cities and towns began recording their own local weather temperatures as an informational service to the residents.
Prior to that time, we have absolutely ZERO temperature data from around the planet Earth. That means that for over 99.9999 percent of our planet’s history since the appearance of hominids, we have no data as to what atmospheric temperatures existed anywhere on our planet. We can make inferences by understanding that there were glacial ice age periods, whereby much of the planet was in colder temperatures but we have no idea what those temperatures, daily or seasonal, were.
There are actually very few records of even descriptive temperature weather events beyond whether it was hot or cold. Daily temperatures were of little consequence to people and the ancients paid more attention to the extreme weather events. Hot and cold had little meaning other than how you dealt with it or maybe talked about it.
So, we have much less than two centuries worth of data based upon a scale that was devised only three centuries ago. Further, that data is sporadic and many of the conditions of sampling were not recorded or reported. Drawing conclusions from this data is like taking a brief look up at the sky and seeing clouds and concluding that the sky is always cloudy.
Further, we know that temperature sampling is very dependent on many factors and cannot give consistent and reliable information. It serves only as a reference point. For example, we know that temperature sampling and information is highly dependent on:
- Sampling Location. We know that altitude can affect temperature readings. Air temperatures decrease within the altitudes that humans exist. That is because the ground and water serve as a source of thermal energy, either reflective and/or through direct transmission.
- Sampling Time. We know that the timing of temperature sampling varies widely during all hours of the day and is not consistent from day to day. One day the high temperature may be 2 pm but the next may be 1 pm, and so on.
- Effects of Terrain and Man Made structures. We know that temperature sampling can be hugely affected by the local terrain and if there is asphalt, concrete, brick, or other such non-natural things present. As an example, check out this reference. I have actually performed experiments whereby I set up several thermometers on my property and none of them record the same temperature even though they are all in almost the same general location, the same height off of the ground, but they experience slightly different conditions (shade, wind, proximity to structures, etc.); I have seen variations of up to 4 C.
Official records can be a source of data that confirms the above.
I went back to the records for Seattle going back to 1900. Because of the extensive amount of data, I randomly chose the maximum temperature recorded for Seattle and I did that for every four years. That data is presented below in Graph 1. Yes, I intentionally “skipped” data on a consistent pattern to save space but you can go to the data and do your own full plot and see what the graph looks like.
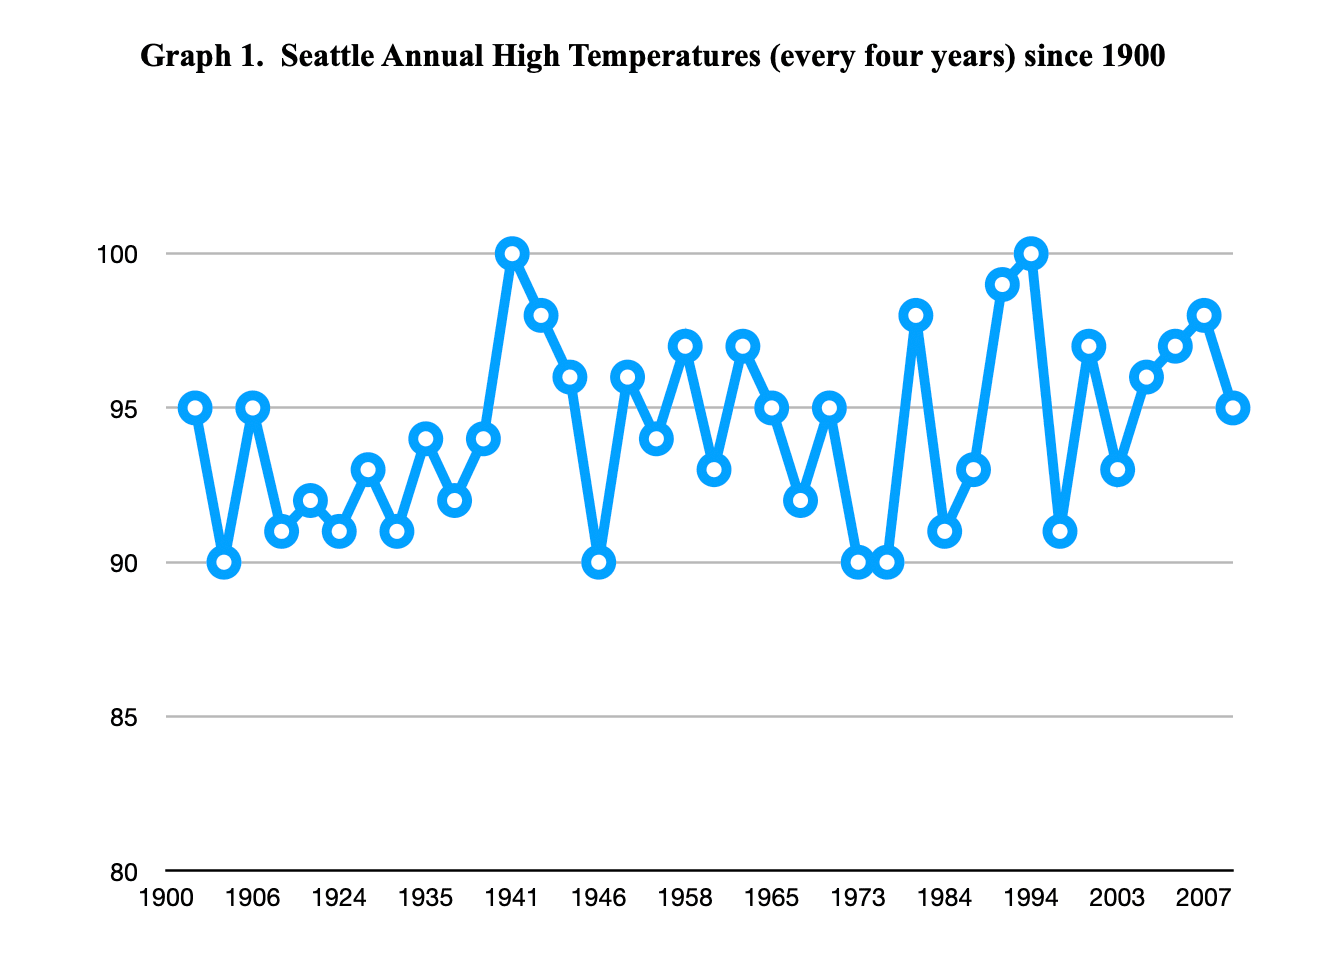
A superficial examination of the data represented in Graph 1 shows something unusual. That is that the data seems less variable from 1900-about 1944 and much more variable after that time. The reason for that is this data is not represented by the same sampling location. Up to 1948, the temperature data was collected at the University of Washington (UW), which is located north of downtown Seattle and alongside Lake Washington. Since 1948, the temperature data reflects temperatures collected at the Seattle-Tacoma International airport (Sea-Tac), which is located on the south side of Seattle adjacent to Puget Sound. The two areas of temperature record are approximately 30 miles apart and can have quite different local weather patterns. Thus, the “Seattle” data is not truly representative of Seattle but represents two different collection points located miles apart.
Extrapolating local temperatures into some worldwide climate model requires extreme caution. The data that is being presented that supposedly supports global warming is all based upon computer modeling and it represents an “average” of planetary conditions. Those are both conditions that have rather significant error bars associated with them.
One of the most serious, underlying assumptions is that the planetary ecosystem is homogeneous. It is not. If you have a large, Olympic-size pool filled only with distilled water and you insert a small syringe into the pool at some location and withdraw a sample and analyze that sample, you might expect to find only the molecule H2O, water-and that is maybe what you will find if you assume complete homogeneity of the pool.
But, chemically speaking, as soon as you fill that pool, the water surface layer will begin to interact with the air around it and the water in contact with the concrete surface of the pool will interact with that surface. That means that the water becomes contaminated to some degree from water soluble air contaminants and surface contamination and whether or not you detect that contamination depends on time, sampling location, sample size, and extent of possible contamination. Further, it depends on what type of contamination you are looking for. If you are looking for a chemical, you will use different techniques than if you are looking for some microbiological contamination.
Thus, if I take a syringe sample of that pool and I only test for and find water (H2O), I cannot claim that the pool is actually pure, 100 percent water. That assumption is based upon total homogeneity and it ignores the possibility of contamination from air and contact sources, as minor as they may be.
For all of these “global warming” calculations and claims, the algorithms should be published for scientific review. The assumptions and conditions should be published for scientific review. The data sampling details should be published for scientific review. The degrees of uncertainty around each sampling point and data point should be clearly identified.
Without examination of all issues, the claims mean nothing.
What Defines a Greenhouse Gas?
Most people probably have some idea of a greenhouse and what it does. It is a structure that moderates temperature and humidity that allows for a more constant growth of green things. I could get more technical but I think people understand the basic concept and certainly if anyone has ever established a greenhouse or has visited one, they understand.
According to the Encyclopedia Britannica, Water Vapor (WV) is the most potent greenhouse gas while CO2 is the most significant. Yet, the meaning of both of those definitions seems to be lost and is not even defined. What is the difference between potent and significant and how does that relate to the “Climate Change” misnomer? To answer these questions, we need to look at some standard thermodynamic chemistry involving gaseous molecules.
First, almost any gaseous molecule has some degree of greenhouse capability as defined by what is known as heat capacity. The heat capacity is the ability of the molecule to “hold” thermal energy and this is related to how it functions at the molecular level. In reference to this capability, the values that I will give in this article are in the units of Joules (J) per gram (g) degree Kelvin or J/g-K and have been determined for most common compounds and reported in the Handbook of Chemistry and Physics.
Second, there is an additional thermodynamic feature that can contribute to the greenhouse capability. That feature is the ability of the gaseous molecule to absorb energy in the Infra-Red (IR) region of the spectrum. It is the IR portion of the spectrum that is generally associated with thermal energy. It is very difficult to quantify the IR absorption capability unless you overlap the actual IR spectrograph of each compound. Thus, this capability is generally qualitatively expressed as “++” for the highest order of absorption, “+” for a good absorber, and “-“ for little or no absorption.
Our homogeneous planetary atmosphere consists of the molecular components of about 78 percent nitrogen, N2, (heat capacity of 1.04 and IR “-“), 21 percent oxygen, O2, (heat capacity of 0.92 and IR “-“) with minor quantities of 0.93 percent argon, Ar, (heat capacity of 0.52 and IR “-“) and 0.04 percent carbon dioxide, CO2, (heat capacity of 0.82 and IR “+”). Since these gaseous molecules do not become liquid or solid under typical Earth conditions (except CO2 can become solid under temperature conditions in the Antarctic region), they represent a reasonably accurate average sample of our atmosphere, although the actual composition of CO2 can vary by location (I will explain later). Most of our greenhouse contribution from the homogeneous atmosphere comes from N2 and O2 since these are in the most abundance (99 percent) and have some good heat capacity (better than CO2).
The “X” Factor in our atmosphere and in terms of greenhouse effect is the presence of water vapor, WV. Our planet has about 70 percent of the surface area covered in H2O. Although water boils at 100 C, it is constantly evaporating under typical surface temperatures, even those near freezing. Certainly, the warmer either the water temperature and/or the surface air temperature, the greater the degree of evaporation and the greater the degree of WV in the atmosphere.
WV (heat capacity 1.86, IR “++”) can exist homogeneously but also heterogeneously (such as in clouds). The amount of homogeneous WV that our atmosphere can maintain depends on the air temperature and pressure. Relative Humidity, RH, is the measure that we use to express the amount of water that the atmosphere is capable of holding in gaseous form under the local conditions of temperature and pressure.
The Encyclopedia Britannica is certainly correct in WV being the most potent greenhouse gas. It has both the highest degree of heat capacity and the highest degree of IR absorption of all atmospheric components on Earth. It can also exist as a homogeneous component or heterogeneous component. That combination means that WV plays the most important role in weather patterns on our planet as well as in the greenhouse effect that is common in many regions of the planet.
Our tropics have warm, humid climates essentially year round because the tropical regions of the planet have the greatest percentage of water and the highest and most consistent degree of energy input from the sun. The tropics are the planet’s natural greenhouse. This is why the tropics are also the home to the many rainforests.
The tropical regions also spawn the most severe weather events (typhoons/hurricanes) not only because of the tropical climate but also in combination with the Earth’s rotational and revolutional velocities (about 1,000 and 65,000 miles per hour, respectively) . This movement creates the Coriolis effect, the “Jet Stream,” and the complexities of atmospheric movement which contributes to the development of cyclonic, warm water-driven storms and all other weather events.
If it is true that WV is the most potent greenhouse gas and that the most potent weather patterns are spawned in the tropics, then we should be able to see clear patterns of increased greenhouse effects (if they exist) in the tropical storm patterns on Earth. That is because we should be seeing an increase in energy-fueled, WV-driven cyclonic events if there is significant warming.
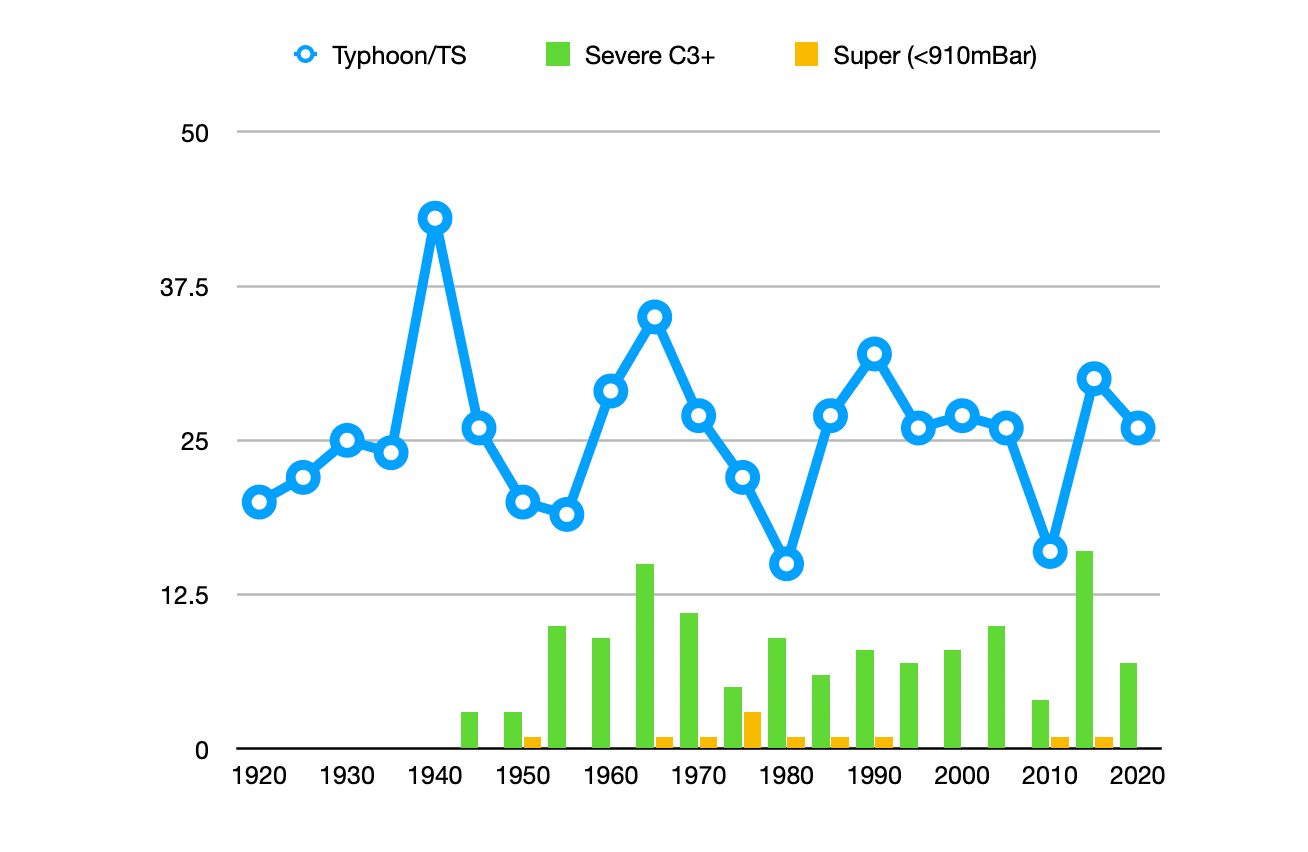
Do we see that pattern? The graph below depicts the frequency and severity of Western Pacific cyclonic storms (tropical storms and typhoons). There is one difficulty in interpreting the data, and that is the same as with local temperature records. The difficulty is that the definition of a typhoon and its severity has changed over time. Still, if there has been significant temperature increases this should lead to greater energy input into tropical storms, meaning greater frequency and strength.
The old definition of a severe typhoon used to be associated with the amount of physical damage it produced on the human scale. The problem with that definition is that not all tropical storms or typhoons actually hit land or land that has modern human population.
For disclosure, over time, there have been attempts to standardize the definition of typhoon but that is still being smoothed out. I established my own definitions based upon the data available. For the total numbers each season (in blue), any storm classified as a tropical storm or greater was counted. The green represents a severe typhoon based upon the more recent categorization as a level 3 or greater (which began in the 1940s). Finally, I added a category that I called the “super” typhoon and since there is still no consensus on this definition (now only referred to as “violent”), I used the central pressure of 910 millibars or less as a definition to be consistent (measurements of pressures also only began in the late 1940s).
Before the 1940s, we have almost no data as to the true severity of storms and maybe even the numbers can be questioned since they are based on storms that were only experienced by humans.
So far in 2023, we have just recorded the presence of tropical storm number 6 as we near the beginning of August. Unless there is some rapid uptake in storms over the next two months, 2023 is on pace to be below 25 storms for the year, perhaps between 20-25.
I find it difficult to see any pattern in cyclonic storms from the tropical climates that indicate any unusual increase in temperatures. What we can see is a typical cycle of storms with some years having more and some years less, with the average hovering around 25 per year. Stronger storms also seem to wax and wane and there are too few of the super typhoons to draw any observation. These data and observations seem to indicate that the most potent greenhouse gas of WV seems to be producing cyclonic storm patterns in a rather consistent mode over the past century.
Is CO2 a Significant Greenhouse Gas?
It is difficult for me to address this question because I really do NOT know what the term “significant” means from a scientific standpoint. Potent I can understand; but significant? Yes, CO2 has both a moderate heat capacity and a moderate ability for IR absorption, which qualifies it as a greenhouse gas.
However, from pure chemical thermodynamics and abundance in our atmosphere, CO2 seems to be a minor player, at best. Its true contribution to the greenhouse effect is almost non-existent when compared to N2, O2, and WV.
We know even less about CO2 concentrations, both historically and contemporarily, than just about every other component of our atmosphere. We only started measuring CO2 in the atmosphere in the late 1950s, so we have less than a century of data. And that data is suspect in its own right-something I will come to below.
There is another fact that people need to understand. Our planet “breathes.” It is not dissimilar to the breathing that humans do without thinking to survive. We breathe in air, we take what we need from that air (mostly the oxygen), and we exhale what we don’t need as well as our unwanted waste products, including CO2.
The planet does the same thing in all ecosystems. Here are examples of our planet breathing using CO2:
- Green plants breathe in the air-the same air as humans. They do not use nitrogen and argon (both are essentially inert)-the same as humans, and cannot use oxygen. But, this very minor little component of our atmosphere, CO2, is what they need. They take in the CO2 and through photosynthesis they exhale O2 (which most animals need to survive). Thus, CO2 is essential to the survival of plants while O2 is essential to the survival of most animals (including humans). There are bacteria species that survive with oxygen (aerobic) and some without (anaerobic). But, any organism that is dependent on photosynthesis needs CO2.
- CO2 also is inhaled by the Earth and contributes to rock formation (limestone formation) which is an ongoing process. By the same token, the Earth also exhales CO2 via volcanism (in fact, volcanoes represent the single greatest natural source of CO2 on our planet).
- CO2 is absorbed by water and goes into aquatic life. Coral reefs depend on CO2 as do shellfish. Plankton depend on CO2 for their contribution to photosynthesis and plankton represent the bottom of the food chain in aquatic environments. Thus, CO2 absorption by the oceans is not a disaster but is important for that ecosystem.
The fact is, we do not know what the historical atmospheric content of CO2 has been and I am willing to argue that maybe we still do not really know. Many computer models have attempted to derive that information but that has mostly been obtained from data derived from limited core sampling on Earth, primarily in Antarctica and from atmospheric measurements.. How representative these core samples and measurements have been of the true atmospheric contents can be debated.
Antarctica is the only place on Earth, now, that is capable of actually freezing out CO2 from the atmosphere into a solid “dry ice” form. Does that fact itself skew the results? Are the scoring techniques really trustworthy? Are we introducing contaminated air during the sampling and/or testing processes? What other conditions were known on our planet that correlate to the computations made from the samples?
In my opinion, CO2 plays a significant role in planetary ecosystems but it seems to have little ability to impact the greenhouse effect, even though by itself it classifies as a greenhouse gas. Thus, I am prepared to debate the contention of the Encyclopedia Britannica that this can be combined to make something described as a significant greenhouse gas.
This also leads to examining the source of the atmospheric CO2 data.
Virtually all of the CO2 data that is used in the computer modeling comes from sampling stations that are located on Mauna Loa in the Hawaiian Islands (which were established in the late 1950s). Since we know that volcanoes are the single greatest natural source of CO2 emissions, why would we put a sampling station on an active volcanic archipelago? Are we truly measuring some homogeneous Earth atmospheric concentration of CO2 or are we actually measuring the output of Hawaiian Island volcanoes? What happens to the CO2 that is exhaled on our planet, i.e. how long does it take to “mix” and become homogeneous in the atmosphere (if ever)?
The only data that could make any sense would come from a rather intense network of sampling locations throughout the world with multiple locations in each climatic zone in order to establish the true nature of CO2 homogeneity in our atmosphere. You would also need to have some sort of control stations that would help in studying what may be produced and what can be considered truly a homogeneous part of our atmosphere.
Further if you want to control the already low concentration of atmospheric CO2, stop deforestation and plant more trees and green things. Green things become the bellwether of CO2. That is one of the simplest and most natural answers to the CO2 question. Plant more green things! You do not have to wait decades for technology to improve; green things grow in weeks and start doing their job of CO2 absorption from the get-go. I know, since I am an amateur farmer.
It is a good thing to make people more aware of wasteful production and to encourage more efficient energy usage, but that is a far cry from trying to change humanity and establish Totalitarian societies.
As Carl Sagan famously said, extraordinary claims require extraordinary evidence. Where is the extraordinary evidence? How does a rather normal greenhouse gas (CO2) that exists in the PPM range in our atmosphere somehow gain the function of completely dominating our climate?
Why do we ignore a more potent greenhouse gas (WV), that exists in far greater ranges and has much more influence on climate? Could it be that we cannot even begin to control humans since we cannot control water due to its abundance on our planet?
Where is the evidence that “Net Zero” is actually a benefit for the Earth? Perhaps it will prove detrimental; what happens then?
Is Methane (CH4) a Significant Greenhouse Gas?
CH4 is a member of what we call the “natural gases.” These include CH4, ethane (C2H6), propane (C3H8), and maybe even butane (C4H10). They are called natural gases for a reason and that is because they can be found all over the Earth. Methane, ethane, and propane are all gases at normal ambient temperatures and pressures. Methane has a heat capacity of about 2 J/g K. Technically, methane could contribute to a greenhouse effect should it achieve significant concentrations in our atmosphere.
However, methane is almost non-existent in our atmosphere despite many natural, animal (such as cow farts) and human sources. The reason that methane does not build up in our atmosphere is based upon basic chemistry. CH4 will react with O2 (abundant in our atmosphere) in the presence of any ignition source. This reaction creates, please hold your breath, WV and CO2. Just like the combustion of any organic material will create WV and CO2 as products.
What are ignition sources? Lightning, fires, engines, matches, spark plugs, fireplaces, and any other flame source. If you project that idea, think about gasoline or other fuels. These fuels do have some evaporation under normal environmental conditions. Even with the modern fuel nozzles, some vaporized gasoline will emit (you can probably smell it). Where does it go? It goes into the atmosphere but as soon as there is some ignition source and if any gasoline molecules are floating around near that source, they will combust and produce WV and CO2.
True, we do not witness little air bursts occurring because this combustion occurs at the molecular level. If there was enough methane in the air in a given space, you would witness a burst with combustion. One lightning bolt can clear the air of any methane that may be lurking just like it can produce ozone by the presence of O2.
I think people can understand why our planet does not accumulate methane.
Cows are not a threat (and never have been). The manure that cows produce also happens to be one of the best natural fertilizer sources for growing green things, which happen to be beneficial in using atmospheric CO2 and producing O2. Thus, cows serve a useful purpose in the ecology of the planet. I will not even go into the benefits of drinking bovine milk, which are well known.
Does a Rise in Sea Level Result Only from Global Warming and Increased Water?
No, definitely not. The one thing that you need to do is to carefully examine all land masses and track the changes. The reason is that the surface of the Earth is neither homogeneous or static. There is something called “plate tectonics.”
Plate tectonics is a theory that explains much of our geological experience and history. What plate tectonics tells us is that the solid surface of the Earth, whether it is above water line or below water, has several segments and these segments are in constant movement and they have complex movements in relation to the other plates. These movements give rise to earthquakes, volcanic activity, and even changes in water flow, such as rivers and oceans.
Further, we know that the tectonic shifts on Earth are not two-dimensional, but are three-dimensional AND unpredictable. Every time there is an earthquake on the planet Earth, the surface of the planet changes. Depending on the size of that earthquake, that change may be imperceptible to noticeable. But, we experience thousands of earthquakes each year on this planet. Certainly, the surface of the Earth is in constant change. There are places on Earth where the water table is generally stable but even a moderate earthquake somewhere on the planet can actually affect changes in the water table (splashing). If that can happen during a minor seismic event, think of what the constant shifting of the plates can do to the perceived water levels.
If the surface of the Earth was like an unchanging surface such as a soccer ball inflated to a specific pressure, then one could expect that any increase or decrease in the amount of water on that unchanging surface should give an indication of change to the amount of surface water. This also presumes that the evaporation and condensation equilibrium of water on that surface remains constant, such that the new source of water comes from solid water located on the surface.
Now, suppose you could take that soccer ball and place a known amount of water on its surface (meaning the soccer ball somehow had gravity to hold that water in place). Further, you are able to mark the exact levels of that water on the soccer ball with a marker. Then suppose that you are able to squeeze that soccer ball, even ever so slightly, and observe the outcome. Will the water levels that you marked remain unchanged? No, there will be fluctuations. In some places, the water level may be less than marked and in other places, it will be more.
We know that this happens on a regular basis on Earth because of gravitational tides, but those are an external influence (from the Moon and Sun, but can be affected even by other planets). Tides also are a daily event and we can predict their schedule because they are so observable.
We seem to ignore our own internal factors, but they do exist.
As far as I know, I am the only one who has stated this obvious, naturally occurring, physical attribute of our planet. Yes, our planet “throbs” and that can affect sea level changes in any given location and may be hard to predict. Further, the planet “throbbing” occurs on a time scale which may be almost imperceptible to humans. Geologists tell us that some areas move many centimeters or more each year while others have much less movement. The mountains may gain in altitude by imperceptible but measurable means (or they may recede).
How do we distinguish any local change in water level from a simple fluctuation of the Earth’s three-dimensional structure as opposed to some change in actual volume? Further, if we can actually ascertain that the change in volume is not due to some fluctuation of the Earth’s structure, how do we know that the change is due to some existential threat? These questions are complex and have not been answered.
What about arctic or antarctic melts? Doesn’t that contribute to sea level rise?
It might if there were no other factors that affect the amount of liquid water on our planet at any time. In other words, if liquid water amounts on our planet were somehow static, then a new source, such as that from a melting glacier, should have some effect. The fact is, water evaporation occurs constantly on our planet and it is not predictable. Likewise, the new addition of liquid water on our planet is constant and also not predictable. The state of water, liquid, solid, or gaseous, is in constant flux or in other words, it is dynamic. We do NOT know what that equilibrium point is.
The contribution of liquid water on our planet comes from mostly the already 70 percent of our planet covered in water. That planetary water source will produce WV via evaporation. Where there is more water and warmer temperatures/greater energy input, the amount of evaporation increases and more WV is produced. There are some minor subsurface sources of water, mostly attributed to what best can be described as surface seepage, but those sources are relatively minor.
From WV, we then get condensation events such as rain and snow. That water then gets used or consumed by the living things that are dependent on it (such as plants, animals, people, microbes, etc.) or returns back into the aquatic ecosystem. But, if there were only consumption, then eventually the balance of water would diminish. However, life on our planet produces water as well as consumes it. Humans consume water for survival but we also produce it as sweat, humidity in our breath, and in our waste (for example urine). We also produce water through our presence and use of technology. Burning wood produces water, for example, as does driving an internal combustion engine. That is good for things that use water.
We also produce CO2, which is good for the many things that use CO2. What we do not know is if the human-sourced production of CO2 is in any way competitive with or additive to the natural sources of CO2 and creating some horrific imbalance. I would not consider a change from 300 ppm to 400 ppm creating a horrific imbalance considering that the other 99.96 percent of molecular components are contributing just as much or more. Perhaps if the thermal capabilities of CO2 were thousands of times greater than the capabilities of our other atmospheric components, I would be concerned-but that is not the case.
Somehow, through all of these complex mechanisms, an equilibrium is maintained. We do not know what that equilibrium is and if it has changed over the eons since water-based life has existed on our planet.
Humans Have Become Experts at Cherry-Picking Information
If you look at the several points that I have made above, you can see this to be true. Humans will pick what they want to pick to support what they want to support. Further, humans seem to have become willing to change their definitions in order to support what they want to support. This is why language is so important and needs to be clear, and why universally accepted definitions are important.
Everyone needs to become a scientific reviewer, especially when watching the Chicken Littles of our media world. You need to ask the basic questions:
- How was the data obtained?
- Where was the data obtained?
- What are the controls that allow for a proper reference point for the data?
- Has data been excluded? If so, why?
- Is the data representative?
- Are we talking about simple, static systems or complex, dynamic systems?
- Are there other explanations for the data besides what is being given?
- Was the data computer-generated? If so, what were the assumptions and parameters that were used?
- Are there arguments or debating points? If so, what are they? If they are being suppressed, why?
- Are there historical perspectives?
- Have the definitions changed? If so, why and is there a consensus on the new definition?
- Why in years past did you report summer temperatures in black font on green map backgrounds and now you push everything in red?
- What is the standard qualification and/or reference point for using “red” or “orange” in your messaging?
- If what you are reporting is being reported as some sort of record, how far back does that data reliably go back to? Have the previous “records” been measured from that same exact location? Have there been any confounding issues that have changed the location or sampling?
And so on. In science, there is no question that is “too dumb.” Even the basic question “I am afraid that I do not understand, can you please explain it to me?” is rational and deserves to be explained.
Our planet is a very complex set of ecosystems that have lifespans far beyond even human existence, some working together and some in competition. Most of these we have not even begun to understand and we have only begun to collect data. Our knowledge of our ecosystem history is only slowly gaining (and it is not aided by avoiding debate and cherry-picking data).
I have selected only a few of the forefront topics to examine in the most cursory way. But, you can see that even a cursory examination seeds doubt about the narratives, creates more questions, and demands greater and more open debate.
I do not claim to have the answers but I certainly am not afraid to ask the questions.
Join the conversation:
Published under a Creative Commons Attribution 4.0 International License
For reprints, please set the canonical link back to the original Brownstone Institute Article and Author.