It was pretty obvious even before February 28th that the US economy was grinding to a halt, even as inflation was already working up a head of steam. But then came war.
We are going to get a globe-shaking economic conflagration erupting from the void that was the Persian Gulf commodity fountain. That includes between 20% and 50% of all the basic commodities that drive global GDP, including crude oil, LPGs, LNG, ammonia, urea, sulfur, helium, and sundry more.
Accordingly, the global share of crucial industrial commodities that now stand in harm’s way. This includes both those directly transiting the Strait of Hormuz and also the share of supply from the wider Middle Eastern region that is also exposed to the current Iranian War disruptions but is delivered by pipeline, train, or alternative waterways like the Red Sea/Suez Canal route.
This ballooning dislocation of daily global commodity flows will have a double whammy effect: It will both cause production and output to fall immediately in response to soaring input costs or limited availability—even as it encourages the central banks to “help” by printing more inflationary money.
This all adds up to a bout of classic stagflation, but it is not going to be merely the mildly painful type that unfolded during the 1970s. After all, despite a 120% rise in the price level during the decade, it wasn’t a total wipeout when measured from the vantage point of real median family income.
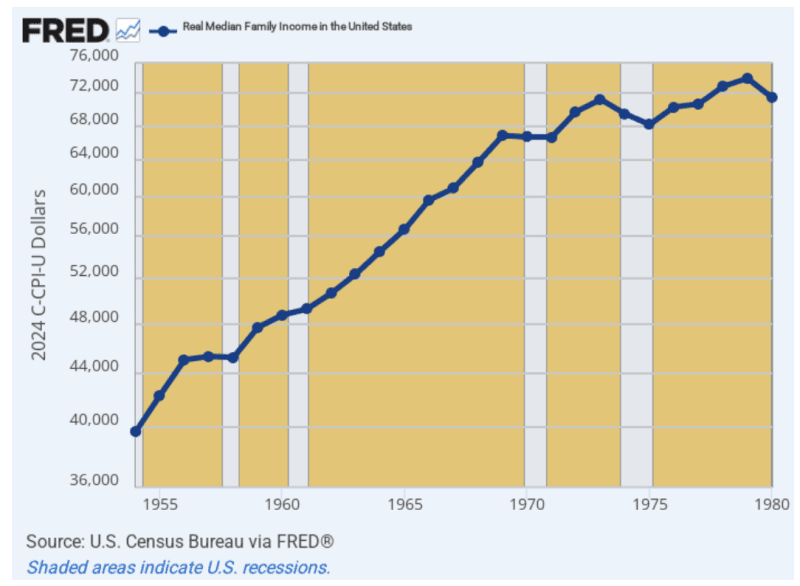
As it happened, the 1970s stagflation came on the heels of what had been an actual Golden Age by the standards of history between 1954 and 1969. During that period, real median family incomes rose from $39,700 to $66,870 or by a robust 3.53% per annum.
Of course, that uphill march of Main Street prosperity slowed sharply during the inflationary 1970s, but the blue line in the chart below did at least keep drifting higher. So between 1969 and 1980, real median family incomes grew by a not very impressive 0.61% per annum, but the direction of travel was still higher.
But here’s the thing. The US economy of the 1970s was able to cope with the pressures of high inflation, oil, and other commodity shocks and the stop-and-go disruptions of a Federal Reserve that had been newly released from the disciplinary effects of the Bretton Woods gold standard. In large part that was because the aggregate level of debt on the US economy was relatively modest.
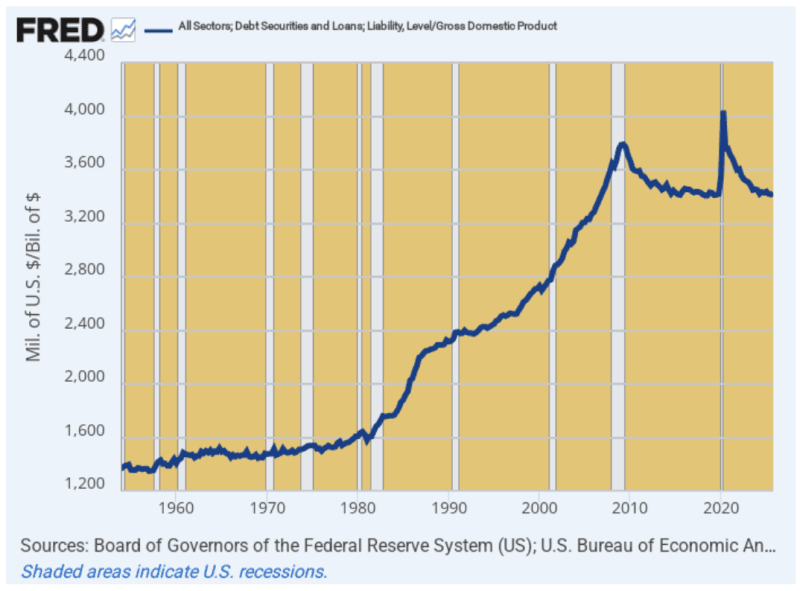
Total public and private debt in 1970 stood at $1.5 trillion, representing just 147% of GDP, as shown in the graph below. Moreover, the latter was the long-time national leverage ratio (total debt divided by national income) through historic times of thick and thin, going all the way back to 1870.
Moreover, even after the large government deficits of the 1970s and a surge of inflation-driven private borrowing during the decade, total US debt stood at $4.6 trillion by 1980. That was just 162% of GDP.
In a word, the US economy during this decade of stagflation was battered by unprecedented peacetime inflation, but it was not yet smothered by crushing debt. As shown by the graph, the soaring national leverage ratio did not really leap skyward until after the mid-1980s, when Alan Greenspan took the helm at the Fed and launched the US (and the world) into a four-decade spree of money-printing and what amounts to Keynesian central banking.
As a consequence, total public and private debt is in a wholly different zip code today. Debt outstanding now totals nearly $108 trillion and weighs in at 343% of national income (GDP). That is to say, as we head into the next stagflationary era, the US economy will be carrying two turns of extra debt relative to income than was the case in 1970.
That does make a difference. The national leverage ratio during the 1970s averaged about 153% of GDP, meaning that had it been maintained since then total debt outstanding would now be $48 trillion. As it is, however, the actual leverage ratio currently stands at 342% of GDP and outstanding debt totals nearly $108 trillion.
So the math tells you all you need to know. The US economy is now lugging $60 trillion more debt than would be the case if the 1970s average national leverage ratio had been maintained. And even at a weighted average 5% interest rate across all sectors of the economy, that’s $3 trillion per year of more interest expense and therefore less cash flow available for investment and discretionary spending.
Of course, Keynesian money printers and statists say “No sweat,” and view debt as a growth elixir rather than a burden on commerce and supply side output. But we beg to disagree, and strenuously so.
The empirical results tell you otherwise. For instance, real economic growth (final sales of domestic product) averaged 3.92% per annum during the 1954 to 1970 era when the national leverage rate was at or below its historical 150% norm. By contrast, since the pre-crisis peak in Q4 2007, real growth has slowed to just 1.97%.
That’s right. The trend growth rate has been reduced by fully 50% after the economy-wide leverage ratio shot the moon during the last 35 years.
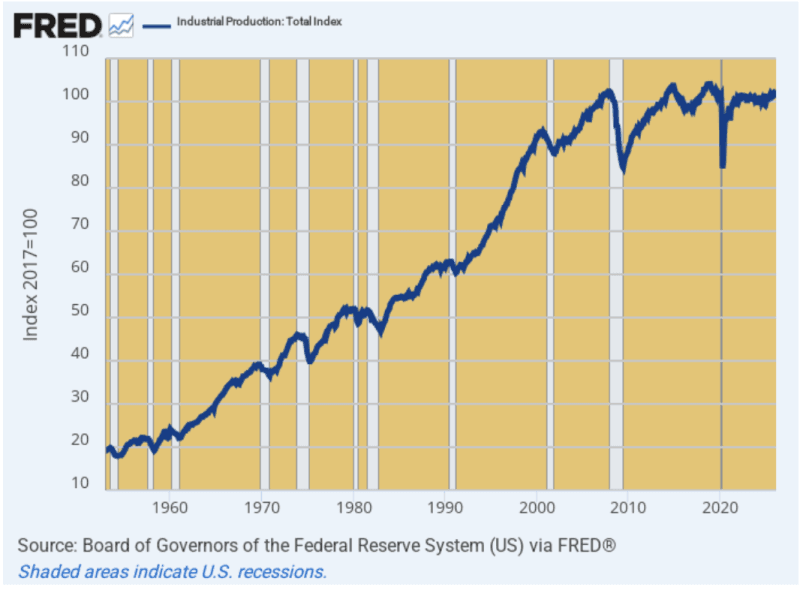
Moreover, in the case of the industrial core of the US economy, the growth rate has not just slowed; it has actually come to a screeching halt.
Thus, between 1954 and 1969, the industrial production index rose by a robust 4.5% per annum. During the years since the debt-fueled financial crisis of 2008, however, there has been no growth at all in the industrial sector of the US economy.
On a net basis, the combined output of the manufacturing, utilities, mining, and energy sectors has amounted to one big fat goose egg.
So the question recurs. Why did we get so much debt and so little real growth after the Fed went full-on Keynesian under Greenspan and his heirs and assigns?
The answer is actually not that mysterious. The explosion of debt from $1.5 trillion to $108 trillion during the 55 years since 1970 happened not because consumers, businesses, and government suddenly became infected with a voracious appetite for debt, but because the central bank falsified its price via endless financial repression and pegging yields far below their natural free market clearing levels.
At the same time, the “cheap” debt that landed on US balance sheets did not go into a huge surge in productive investment, but instead fueled decades of financial asset inflation, leveraged speculation, and financial engineering in the corporate sector. The net result was malinvestment and wasted capital, labor, and other economic resources on an epic scale.
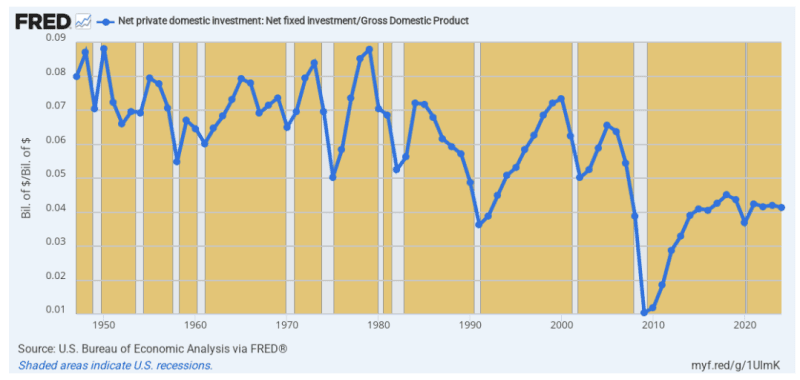
For instance, if the dramatic increase in the national leverage ratio since the heyday of prosperity during the 1950s and 1960s had actually gone into productive uses, it would necessarily have shown up in its counterpart—the national investment rate.
But no cigar there, of course. In fact, the 8% of GDP investment ratio (business capex and housing) has now dropped to just 4%. That is to say, all of the incremental borrowing went into government spending, current consumption, and financial asset inflation, not productive assets capable of generating future contributions to growth and living standards.
This brings us to the impending stagflation. As it was prior to February 28th, real output growth had already stalled. According to the real GDP statistics, growth between Q4 2025 and Q4 2025 posted at just 1.78%. But virtually all of that was due to the AI bubble-driven massive increase in spending for data centers and other AI infrastructure.
This massive diversion of capital was not owing to an overpowering use case for AI or the fact of superior returns on AI investments. In fact, there has been virtually no return on AI assets at all, with the surge of capital spending amounting essentially to a new version of “Build it and they will come.”
But after February 28th and Trump’s initiation of a war in the Persian Gulf that can’t be won and which will send the global economy into a tailspin like nothing seen since the mid-1970s, we are truly off to the stagflationary races.
Energy and fuel costs have already soared. Most importantly, the workhorse hydrocarbon of the US economy—diesel fuels used by the nation’s massive fleet of trucks, rail, and farm tractors—is already above its 2022 level at $5.40 per gallon and still climbing.
Likewise, on the very eve of the planting season fertilizer costs have already doubled, meaning that application rates will be cut back, yields will fall, and food prices will be soaring by the 4th of July when the USDA crop condition reports pretty much forecast the fall production levels.
And, of course, no one took into account that the natural gas processing plants of Qatar were fastened at the hip to the semiconductor plants in South Korea and Taiwan and from there to the entire manufacturing sector of the world. All of this through the life line of helium gas extracted from natural processing plants.
In short, these soaring commodity prices are going to push the inflation indices higher, even as industrial output contracts owing to rising costs and limited availability. Labor markets are frozen as much as they were in the depth of lockdowns from April 2020, while new home sales are evaporating.
That’s stagflation by any other name, but this time the Fed will not be in a position to do much about either inflation or recessionary pressures.
The inflation genie is now out of the bottle but the Fed can not really slam on the brakes ala Volcker because the US economy is staggering under $60 trillion of incremental debt.
At the same time, the war and the erupting commodity inflation cycle it has engendered means that it can’t turn on the printing presses to “stimulate,” either.
So, as we said: This is not your grandfather’s Stagflation. Not by a long shot.
Reprinted from Stockman’s private service
Join the conversation:
Published under a Creative Commons Attribution 4.0 International License
For reprints, please set the canonical link back to the original Brownstone Institute Article and Author.