
Here we go again. The Fed has spent the last 16 years fueling the mother of all financial bubbles on Wall Street. And by way of spillover effects on the mortgage market, it has also fostered parallel bubbles in commercial and residential real estate assets alike, across the length and breadth of the land.
Now these bubbles are once again bursting, of course, under the inexorable force of economic gravity (i.e. unsupportable debt and absurd valuation multiples), meaning that both ends of the Acela Corridor will be soon bleating loudly for another round of bailouts and frenetic money printing. But before the powers that be are able to rekindle yet another monetary rinse-and-repeat episode, the question recurs as to what has been accomplished since August 2008 by the $6.5 trillion increase in the Fed’s balance sheet over that interval?
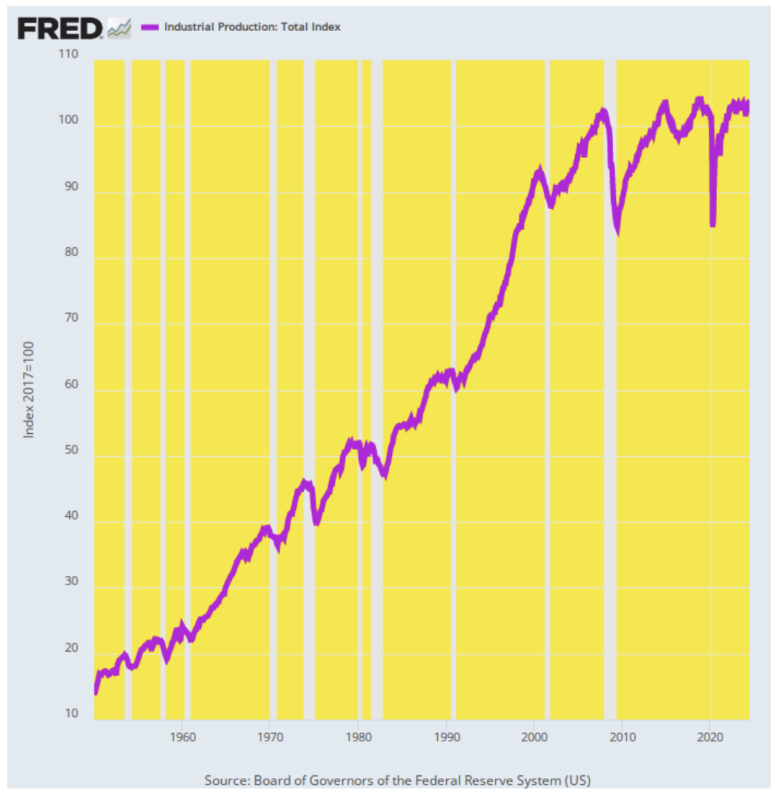
Well, when it comes to measuring the bread and butter output of the US economy—manufactured goods, energy, mining and gas, electric, and other utilities—the answer is pretty much nothing. The industrial production index today stands hardly a tad above its August 2008 level. To be exact, the index has gained just 0.15% per annum during the last 16 years.
That’s an abrupt comedown from the prior trend. As it happened, between 1950 and 2008, the industrial production index rose by 3.50% per year. That is to say, unprecedented money-pumping and the resulting diminutive level of interest rates generated an industrial output growth rate equal to only 4% of its historic level, and not for a year or two but the better part of the first quarter of the Twenty-First century.
Industrial Production Index, 1950 to 2024
Our Keynesian monetary central planners, however, would say the flatlining of industrial production makes no nevermind because they have managed to keep total GDP expanding at an arguably respectable rate. Thus, between Q2 2008 and Q2 2024 real GDP rose from $16.9 trillion to $22.9 trillion or by 1.91% per annum, according to the official statistics. That was well short of the 3.41% per annum growth rate over the same 1950 to 2008 interval, but at 56% of its historic average, it wasn’t macroeconomic chopped liver, either.
Except, except. When you look at the internals, the real GDP woodpile is heavily populated by statistical skunks—most especially when it comes to the inflation indexes used to deflate the nominal data for spending and output. And, if you materially undercount inflation you can easily turn a macroeconomic sow’s ear into the semblance of a silk purse.
As reported, for instance, the goods component of real GDP rose from $3.37 trillion in Q2 2008 to $5.45 trillion in Q2 2024. That $2.08 trillion gain computes to a fulsome growth rate of 3.05% per annum, thereby lifting the top-line real GDP figure considerably.
But we’d say, not so fast. The official GDP accounts also say that the inflation rate for this component of “real” GDP averaged only +0.73% per annum for the entire 16-year period—including the huge inflation flareup since 2021. Anyone who has spent the last decade and one-half in the real world who believes that fanciful figure either works for the Fed, Wall Street, or a swampland real estate broker in the Everglades.
To the contrary, we’d put the odds heavily on at least a 2.0% average goods inflation rate over the 2008-2024 period, meaning that the goods component of real GDP likely grew at $1.1 trillion over the period, not $2.0 trillion.
Likewise, the official counts claim that the $2.74 trillion healthcare component of GDP (Q2 2024) grew by 2.68% in real terms over the 16-year period from a level of $1.79 trillion in Q2 2008. That might sound reasonable until you note that the nominal figure for health care PCE was deflated by just 1.95% per annum.
Of course, that merits the proverbial, puleeese! The health sector is an inflationary trainwreck owing to the fact that massive government and third-party reimbursement system totally neuters the normal checks and balances in the marketplace owing to consumers watching their checkbooks. So it actually takes some gall on the part of the green eye-shades at the BLS to claim that medical care inflation came in at less than 2% per annum.
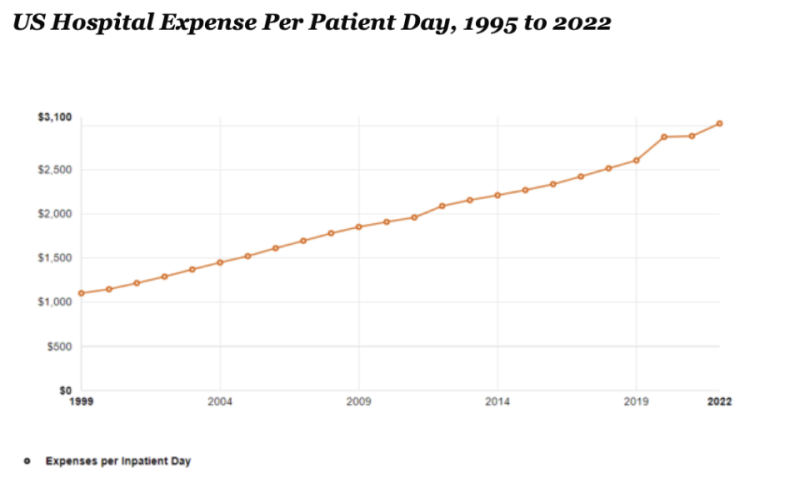
For instance, hospital expenses per patient day have more than tripled since the turn of the century and averaged +3.4% per year between 2008 and 2022. And that gain represents pure inflation, given that it’s standardized per patient day and there has likely been no so-called hedonic gain in the “quality” of hospital stays and treatments in recent years. Indeed, most likely it’s been the opposite.
US Hospital Expense Per Patient Day, 1995 to 2022
So give it a break and assume that healthcare inflation averaged 3.0% during 2008-2024. Even that figure would represent a considerable slowdown from the 4.2% per annum rise in the CPI for medical care during the previous 16 years (1992 to 2008). With ObamaCare and huge Medicaid expansions hitting the market after 2009, in fact, there is no reason at all to believe that true medical care inflation abated at all.
In any event, a health care deflator increase of just 3.0% per annum over the 16-year period would cut the real GDP figure for health care PCE to $2.32 trillion as of Q2 2024. In turn, that would reduce real growth over the Q2 2008-Q2 2024 period to just $530 billion or barely half of the official figure (+$950 billion).
Then we have the business investment component, where the official real GDP data show an increase from $2.06 trillion in Q2 2008 to $3.39 trillion in Q2 2024. Again, this $1.33 trillion gain is nothing to sneeze at, representing a robust growth rate of 3.18% per annum.
Then (also) again, to get that latter figure you need to believe that capital goods inflation over that 16 year-period averaged, well, just 0.99% per annum. Now, how in the world did an economy that experienced general inflation of about 2.6% per year over 2008 to 2024 according to even the 16% trimmed mean CPI manage to generate inflation of less than two-fifths of that figure (0.99%) in the capital goods sector?
Well, can you say, “hedonics?” And offshoring, too.
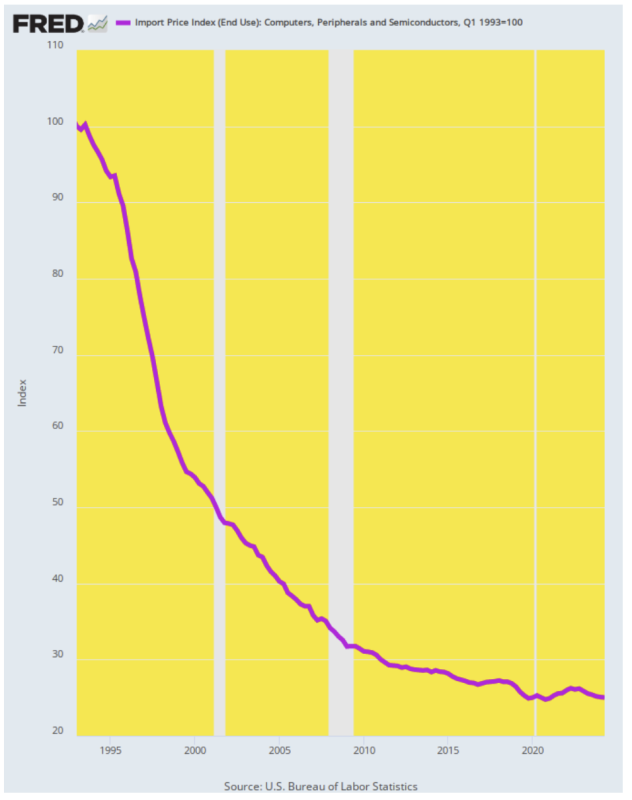
Or stated differently, do you believe that prices for the main component of current-day business capital spending—computers, peripherals, and semiconductors—have plunged by 75% since 1993?
Yes, the power, speeds, and capabilities of computers have increased enormously since 1993, but nobody is buying an IBM PS/2, Compaq Deskpro, Apple Macintosh LC III, or Packard Bell Legend anymore. So to function at a keyboard and on the internet you have to buy the advanced capabilities of today’s brands and models, whether you want all the bells and whistles or not.
In short, as far as we can tell standard PCs went for about $700 to $1,000 per unit back then and range from $1,000 to $1,500 today. So prices are up by about 75%, not down by 75%. The difference, apparently, is hedonics for which neither business nor consumer incomes bear an extra allowance.
Index of Import Prices For Computers. Peripherals and Semiconductors, 1993-2024
Finally, we have the perennial boost to the GDP figures from, well, government “production” of public sector goods and services. The Keynesian designers of our national income and products (NIPA) accounts, of course, held it as axiomatic that government converts involuntarily extracted income from the private sector into value added in the public sector.
Then again, the taxes extracted from private sector incomes originated in private sector output. So the Keynesian NIPA accounts actually credit what amounts to “born again” output to public sector GDP.
Moreover, even if you want to give credit to the 22% of government GDP accounted for by defense spending or the 61% accounted for by state and local government services and pork, this “output” may not reflect very much real value-added at all. And the same is surely true for the $10 billion of annual TSA output at the Federal level, which presumably includes the 2 billion shoes examined each year to no apparent avail.
Nevertheless, the numbers are big in the scheme of things. Real GDP attributable to the government sector in Q2 2024 amounted to $3.94 trillion at an annual rate—a figure that was up by $526 billion since Q2 2008. In a loose sense, that constituted “growth” if you aren’t too picky about what you count.
Still, we note that government output largely consists of bureaucrats’ wages and salaries. In 2008, government employee compensation amounted to $1.13 trillion, which was distributed to 22.483 million payrollers at $50,000 per head. By Q2 2024, however, the government payroll had soared to $1.86 trillion, representing $80,000 per head for the 23.29 million government employees.
Thus, government pay increased over that 16-year period by at least 3.0% per annum. So we are hard-pressed to understand how the NIPA accounts came up with a deflator for the defense portion at just 1.94% per annum and a deflator for the government sector as a whole at just 2.38% per annum. Indeed, how in the hell can you measure government inflation at all when there are no prices on 99% of its output?
Still, even by the lights of the NIPA accounts real GDP in the government sector grew by only 0.9% per annum over 2008 to 2024. So if you make an even modest adjustment for understated inflation and the self-evident economic waste, you can easily get to a figure of $3.4 trillion for government sector output in Q2 2024. In turn, that would mean zero real growth in the government sector over the past 16-year period, not the $526 billion gain reported by the government statistical mills.
Of course, there is a lot more dubious reckoning in the NIPA account akin to where these items came from. For instance, in the large $3.465 trillion account for housing and utilities PCE—fully 58% or $2.02 trillion is accounted for by imputed homeowners rent. That is to say, the BLS’ wild-ass guesses as to what 50 million US homeowners would pay in rent were they to move into a tent somewhere and rent out their own castle at market rates.
In any event, we think the evidence is overwhelming that real GDP did not grow from $16.943 trillion in Q2 2008 to $22.919 trillion in Q2 2024, or by 1.91% per annum. In fact, if you make the following realistic adjustments, real GDP barely grew at all during the last 16 years, posting a growth rate of just 1.2% per annum.
Adjustment to the official Real GDP Accounts for Q2 2008 to Q2 2024:
- Assume goods inflation of 2.0%/annum versus 0.73%: -$983 billion.
- Assume Health Care Inflation of 3.0% versus 1.95%: -$417 billion.
- Assume Business Fixed Investment Deflator of 2.0% versus 0.99%: -$493 billion.
- Assume higher than official government inflation and waste resulted in zero government sector growth: -$526 billion.
- Total Inflation and Other Adjustments to NIPA accounts: -$2.419 trillion.
- Adjusted Real GDP Level, Q2 2024: $20.500 trillion.
- Adjusted 2008-20124 Real GDP Growth Rate: 1.20% per annum.
In all, after $6.5 trillion of Fed money-printing during the last 16 years, the Main Street economy has nothing to write home about. It has grown at a very tepid 0.15% (industrial production) to 1.2% (adjusted real GDP) rate, at best. And that begs the question, of course, as to where all the Fed’s endless monetary largesse actually ended up.
The spoiler alert should be evident enough already. It ended up in rampant speculation, Wall Street financial bubbles, malinvestment on Main Street, and gifts to the Red Ponzi and other foreign vendors of off-shored US production.
Reprinted from David Stockman’s Contra Corner
Join the conversation:
Published under a Creative Commons Attribution 4.0 International License
For reprints, please set the canonical link back to the original Brownstone Institute Article and Author.