
Since money-printing went into permanent high gear after the dotcom crash in 2000, the top 1% of households have gained $20 million each in inflation-adjusted net worth. Likewise, the top 0.1% or 131,000 households at the tippy top of the economic ladder have gained $88 million each in inflation-adjusted net worth.
Needless to say, the net worth gains available to the wage-earning classes are almost exclusively from what they manage to save after absorbing the relentlessly rising cost of living. And we do mean relentless. Even though the CPI tends to undermeasure the cost of living on Main Street owing to its flaky hedonics’ adjustments for “quality” and other statistical razzmatazz, this imperfect proxy for the cost-of-living is still up by 82% since the turn of the century.
Accordingly, during the last 22 years the median real annual wage, as tracked by Social Security payroll tax records, has risen by only 14.5% or just $235 per annum. And, no, we didn’t omit any zeros from that figure. These piddling gains amount to just $4.50 per week on average.
These annual inflation-adjusted gains in the median wage compare to real net worth gains of nearly $1 million and $4 million per annum for the top 1% and top 0.1%, respectively. In relative terms, these annual wealth gains for the top 1% were 4,250X larger than the median real wage gain and 17,000X larger for the top 0.1%.
Needless to say, outsized gains at the top of the economic ladder are not owing to a superior growth of national income, which, in turn, might have been reflected in higher capitalized values for financial assets. Instead, the bulk of these gains are attributable to valuation multiple expansion. Thus, the net worth of the top 1% computed to 135% of GDP in 2000, but now stands at 207%. Likewise, the net worth of the top 0.1% rose from 50% to 85% of GDP during this 22-year period.
Stated differently, the values of stocks, bonds, real estate and other financial assets have soared because the Fed’s massive emissions of cheap credit and excess liquidity have caused their prices to be bid skyward by leveraged speculators. And that part of the problem can only be effectively addressed by banning the Fed from conducting open market operations on Wall Street and owning or collateralizing government debt, as we amplify below.
But that’s just half the problem. On the other end of the economic ladder, the real median wage as cited above has lagged badly because the Fed’s inflationary policies have drastically reduced the purchasing power of domestic wages. At the same time, it has also fostered a massive offshoring of high-productivity, high-pay goods and services output and employment, thereby causing the mix of wages in the US economy to skew steadily lower.
In this context, the Social Security Administration’s recent release of annual wage statistics for 2022 is an eye-opener, and also puts the lie to “Joe Biden’s” preposterous bragging about the Administration’s economic accomplishments.
It turns out that the above cited median annual wage for 2022 was just slightly above $40,000, and that by definition half of the nation’s 172 million workers with wage records earned less than that amount. To be exact, 84.5 million workers posted annual earnings of $40,000 per year or less in 2022, with an average annual earnings level of just $17,900.
That’s right. The average worker in the bottom half of the wage distribution generated earnings that do not even remotely support a middle-class living standard. In fact, this figure amounts to only 65% of the Federal poverty line for a household of 4 persons ($27,750) and is barely above the $14,580 poverty level for a single person household.
In other words, the overwhelming bulk of the 84.5 million workers in the bottom half of the wage distribution pulled in paychecks over the course of 2022 which were below or just above the Federal poverty line!
That is to say, the US economy is badly broken, yet you do not hear a peep from either wing of the Uniparty. The above cited figures have been the same in relative terms for many years, yet the Donald claimed to have produced the Greatest Economy Ever and Sleepy Joe has the nerve to endlessly tout the virtues of Bidenomics.
As it happens, a good part of the problem is that the overwhelming bulk of these 84.5 million workers not only receive low hourly rates, but also experience gainful employment only on a part-time or intermittent basis.
For instance, there were nearly 29 million payroll records in 2022 where total earnings were less than $10,000 with an average of $4,250. Even at the minimum wage, the latter would amount to only 566 hours of paid employment or about 28% of a standard 2,000-hour work year.
Likewise, there were nearly another 10 million workers who posted earnings of between $10,000 and $15,000, with an average of $12,477. Again, that amounts to just 1,650 hours of paid work, even at the Federal minimum wage.
In all, these 39 million bottom-of-the-ladder jobs generated about $244 billion of aggregate wage income in 2022. That was roughly equal to the $236 billion earned by the 28,500 workers with wages of $3.5 million or higher.
Again, the problem is not that 28,500 workers made a lot of money last year, averaging more than $8 million each. Presumably their talents and value-added in the marketplace warranted such wage and salary compensation.
The real problem is that the US economy has done such a poor job of generating middle-class employment opportunities that it took 1,400X more workers at the bottom of the labor market to generate the same amount of wage income as the top-tier earners.
In all, the 84.5 million workers below the median annual wage ($40,000) generated $1.51 trillion of aggregate wage income in 2022. That is to say, 50% of the employed labor force generated just 15% of the $10.53 trillion of aggregate wage income reported by the Social Security Administration.
Moreover, given the skew to the low wage end, the average income of the bottom 50% of workers computed to only the aforementioned $17,900. And to repeat, that’s not a typo, either. It’s the actual average wage income of 84.5 million US employees, who represent a larger work force than the total population of either England, France, Italy, or even Germany.
In short, a huge share of the workforce is no longer even remotely middle-income. That’s underscored by the fact that the other half of the US workforce—the 84.5 million workers with 2022 wages above the median level—generated an average income that was nearly six times higher at $102,000.
So the question recurs. Why isn’t the US economy generating middle-income jobs at the scale needed to provide better opportunities to the 84.5 million workers below the median wage level?
The short answer, of course, is that the US economy desperately needs far less speculation on Wall Street and far more productive investment on Main Street—when, in fact, the opposite has been happening during the past two decades.
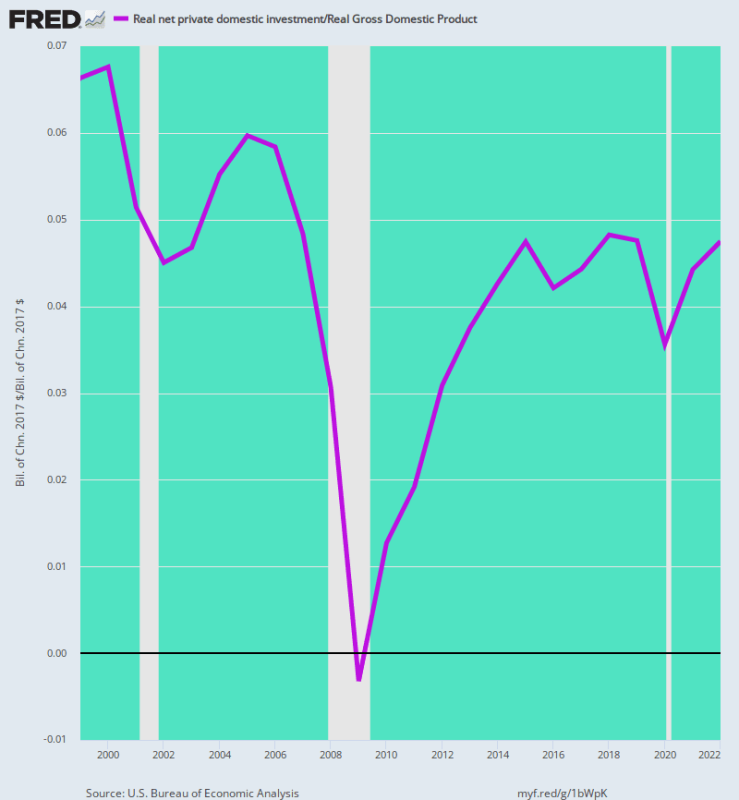
To wit, net real private investment (i.e. after inflation and D&A) declined from 6.7% of real GDP in the year 2000 to just 4.8% as of 2022. Yet given the fearsome competitive pressures of the global labor and product markets, the US economy actually needs net investment at rates well above historical levels.
As we will show in Part 3, however, unless the Fed’s open market operations are completely shut down in favor of a return to a purely discount window-based modus operandi, there is not a snowball’s chance in the hot place that this will happen. As long as the Fed is in business cheek-by-jowl with the hedge funds and speculators of Wall Street, it will be their captive. So ensnared, it will continue to flood the financial markets with the cheap debt and artificial liquidity which is the mother’s milk of speculative excess.
Real Next Domestic Investment As % Of Real GDP, 1999 to 2022
Reprinted from the author’s private consulting service
Join the conversation:
Published under a Creative Commons Attribution 4.0 International License
For reprints, please set the canonical link back to the original Brownstone Institute Article and Author.