
This analysis originated as a student project in my Data Science course at Palacky University, Czech Republic. Several students contributed, with Michal Malcik doing the most. It might be one of the more consequential pieces of coursework.
Introduction
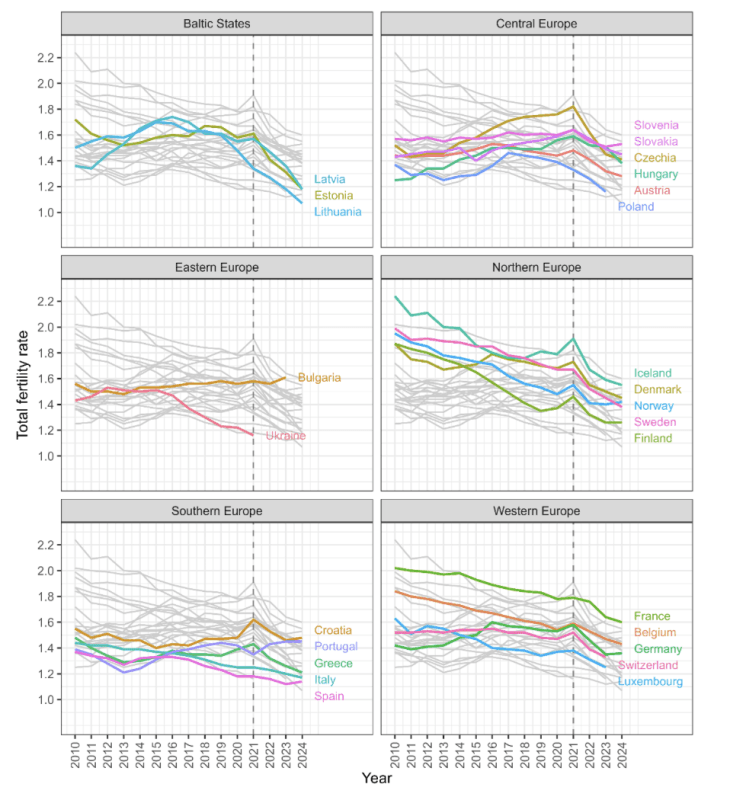
At the beginning of 2022, the Total Fertility Rate (TFR) in many European countries started to decrease dramatically. A rapid and unexpected decline in TFR has occurred in all the Baltic states, across Northern Europe, Central Europe, and in all major countries of Western Europe. Only Greece, Spain, Italy, Croatia, and Romania did not exhibit such dramatic declines, while Portugal and Bulgaria even experienced TFR growth (see Figure 1).
This dramatic and unexpected change in TFR dynamics that occurred synchronously across most of Europe begs for an explanation. Several mechanisms have been proposed in the mainstream media.
- The aging of population and changes in the size of the fertile cohort. However, the TFR is a statistical measure which is independent of the size of population and its age structure. Thus, while population size and age structure do affect natality (aka birth rate), they do not affect the Total Fertility Rate. The TFR is the average number of children that are born to a woman over her lifetime (assuming the age-specific fertility rates remain constant through their lifetime, and they survive until the end of their reproductive life).
- The prize shock brought to Europe by the war in Ukraine. However, inflation in Europe started climbing to exceptional levels as late as summer 2022. This is nearly a year after the factors behind the decline in TFR would have taken place.
- The epidemic of infections with the SARS-CoV-2 virus. However, a large part of the European population was infected during 2020, yet the TFR in most countries actually went up in 2021 (see Figure 1). It would be difficult to argue that one strain of SARS-CoV-2 does not affect TFR while another does.
- The effect of Covid lockdowns. However, the most stringent (and most surprising) lockdowns happened in 2020, yet the TFR in many countries actually went up in 2021 (see Figure 1).
- A broader shift in the values of the population. However, such a shift would have to occur simultaneously across many countries with different history, religion, values, economic cycles, ethnic composition, and population dynamics. Moreover, one would have to show that this dramatic shift occurred exactly between the two most dramatic events of the last generation – the start of the Covid pandemic and the war in Ukraine. All of that is highly unlikely.
Yet, there is another factor which is almost never discussed in public. In the spring of 2021, millions of women of child-bearing age were subjected to the experimental mRNA vaccine against Covid. Since the beginning of the vaccination campaign, there have been many reports of menstruation disorders after the vaccines. In the largest pharmacovigilance database, the VAERS, the number of stillbirths/miscarriages reported after a vaccine jumped from less than 100 before 2020 to more than 3,000 after a Covid vaccine in 2021 alone. The number of menstrual disorder reports increased from lower hundreds before 2020 to more than 27,000 after a Covid vaccine in 2021 alone. Thus, an adverse effect of the Covid vaccines on fertility is plausible.
Moreover, the rapid and unexpected decline in fertility started about 9 months after the mass vaccination event took place. Thus, it is natural to ask if the vaccines have caused this decline. It is notoriously difficult to answer causal questions from observation data. However, the first step in this quest is to establish association.
Data Description
For American readers, some comments about the Czech healthcare landscape are necessary: Everything is very “homogeneous” here. We have universal, free, and very regulated healthcare, so almost everyone gets the same care (allowing for some corruption here and there). Everyone is entitled to free healthcare the extent of which is prescribed by a government decree. From the communist times, we inherited the system of compulsory “personal citizen numbers” (state-provided IDs), so everyone is very well accounted for.
The Czech state collects a huge amount of healthcare (and other) data that are connected to the state-provided IDs and centrally stored. Although we have “health insurance companies,” they all have to cover the same care for everyone and are financed by the state through a compulsory universal “health-tax” collected as a percentage of income. Consequently, the Czech official healthcare data is so precise, clean, homogeneous, and detailed that nothing comparable will ever be available in the US. So, if answers can be found in this type of data, they will be especially apparent and irrefutable in the Czech data.
Recently, a unique database was published by the Institute of Health Information and Statistics (IHIS). The database contains over 17 million lines. There are six types of events that the data covers: Covid vaccination, Covid infection (i.e. a positive PCR test), childbirth, spontaneous abortion, induced abortion, and death (of the woman). If a woman in the Czech Republic experienced any of the above listed events between 1.1.1994 and 31.12.2023, there is a single line in the CSV file for that event.
Each woman has a unique identifier so that events that occurred in the same woman can be paired. In the original version of the data (that was taken down in the meantime, probably due to concerns about individual identification), the year of birth for each woman was provided and the month and year for each event was provided. In the new version of the data, only the decade of birth is provided, and the year of each event is provided.
The data contains approximately 9.6 million vaccination events, 2.2 million infection events, 3.0 million births, 370,000 spontaneous abortions, 830,000 induced abortions, and 1.6 million deaths. Each death has a unique ICD-10 code providing the cause of death. To our knowledge, it is the only publicly available database that connects reproductive events with Covid vaccination data at the level of individual records.
Methods
To show an association between an intervention and an outcome, the Self-Controlled Case Series (SCCS) design may be used. In this design, individuals act as their own controls. We used the SCCS design to study the association between Covid vaccination (exposure) and childbirth (outcome). One has to be careful in this case because both the exposure (vaccination) and the outcome (childbirth) are influenced by the will of the women and can be planned well in advance. The SCCS design is often used in assessing vaccine safety; however, while the decision to accept the vaccine is usually voluntary, the onset of an adverse event is not. The SCCS design overcomes the problem of unobserved confounders that plague comparisons between vaccinated and unvaccinated cohorts (see our Mirror of Erised study). It also solves the problem that each individual underwent the intervention at a different time.
Results
We selected all women born between 1975 and 2024 who were vaccinated by the first dose of any Covid vaccine and who gave birth to at least one child between 1993 and 2023. We divided this cohort into six birth cohorts and plotted the number of births (per 1,000 women in the respective birth cohort) as a function of the month relative to the month of the vaccine. Figure 2 shows the amazing patterns that emerge.
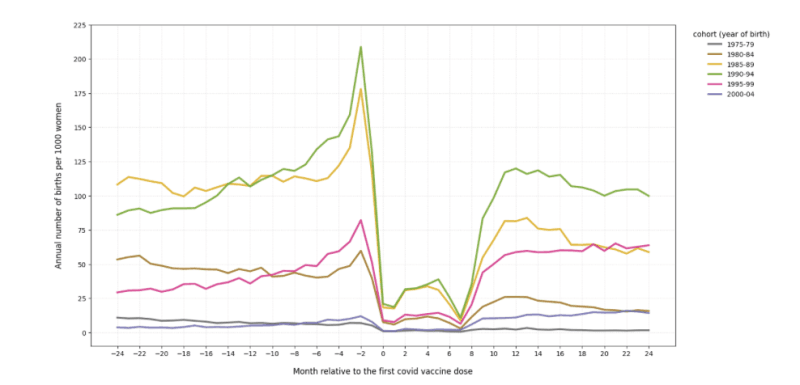
The following features are interesting.
- There is a sharp peak in the number of births (especially in women at the peak of their fertility) about 2 months before the first dose. This means that many women postponed vaccination to after childbirth. The peak is less pronounced in the youngest (gray) and oldest (blue) cohort. It is important to note that the horizontal axis does not represent actual time – each woman has her own time beginning with the month of the first dose. Thus, neither the peak nor the trough can be observed in the Czech population data. It is the magic of the SCCS design that makes this pattern visible.
- There is an order of magnitude drop in the number of births at month 0 (i.e., at the month of vaccination) followed by eight months (0–7) of very small numbers. This means that women avoided the vaccine if they knew they were pregnant. Month 0 is the very month of vaccination – few women wanted to get vaccinated at the month of childbirth. Giving birth in month 7 after the first dose means that the first dose was administered 7 months before the childbirth – i.e., around the second month of pregnancy, i.e., around the time the woman learned she was pregnant. Very few women wanted to get vaccinated if they knew they were pregnant. This is interesting, especially because the Czech authorities recommended Covid vaccination during pregnancy. Figure 2, among others, clearly depicts the lack of trust of Czech women towards the authorities.
- The number of births rises in months 8–11 back toward baseline. This means that women who either wanted to get pregnant (childbirths 9–11 months after the first dose) or were pregnant already and knew it (childbirths 8–9 months after the first dose) also tried to avoid the vaccine.
- Since the cohorts are fixed by birthdate, their age and their fertility changes so it cannot be expected that after the trough, their birth rate would return to pre-vaccination levels. E.g. women born 1985–1989 (yellow line in Figure 2) were past 35 in 2020, and so their fertility was already decreasing. On the other hand, women born 1995–1999 (pink line) were past 25 in 2020 and their fertility was increasing. Thus, it is difficult to draw any conclusions from the behavior of the graph before and after the anomaly caused by the first dose. Comparison with the unvaccinated cohort is difficult due to confounding and due to the absence of the pivot month (i.e. the month of the first dose).
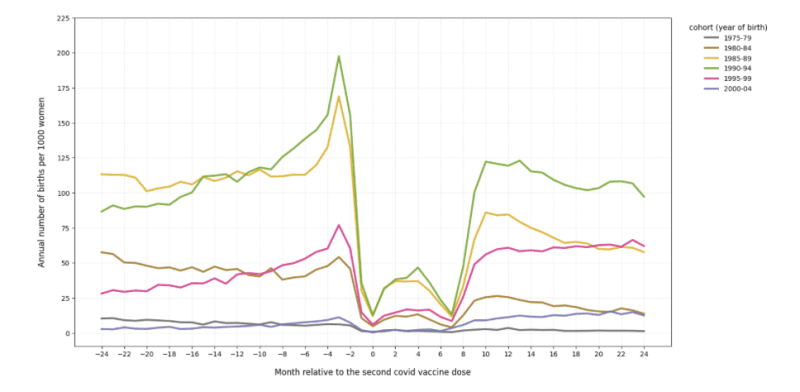
To check the stability of the pattern, we repeated the analysis with the month of the second dose as month zero. Since most women vaccinated with dose 1 went on to receive dose 2 about a month later, we expected to see a similar pattern, only shifted about one month to the left. This is almost exactly what can be observed in Figure 3.
Discussion
The main effect that Figures 2 and 3 show is that in Czech women, vaccination against Covid is very strongly associated with low birthrate. This association is beyond any doubt and no further proof is required, although it would be nice to see this type of analysis repeated in other countries. Also, it is obvious that this association is causal in the sense that the pattern is not the result of a coincidence or confounding.
The main question is the direction of the causal effect. Either the vaccine reduces the probability of becoming pregnant, or pregnancy reduces the willingness to get vaccinated, or both mechanisms are at work simultaneously. The second possibility is almost certainly true. Czech women are much more sensible than Czech vaccinologists and generally tried to avoid the vaccine while pregnant or before conception. As a result, births became “concentrated” in the unvaccinated group, which led to lower fertility among the vaccinated, especially shortly after the vaccine.
However, if this was the only causal mechanism at work in 2021, the total fertility rate of the whole population (regardless of vaccination status) would not have changed. Czech women would simply have split into those who want a child and do not want the vaccine, and those who do not want a child and do want the vaccine. Such a division would have had no effect on the overall fertility of the population. It would be like placing shorter women on the left side of a basketball court and taller women on the right—the average height of women on the field would remain unchanged.
However, total fertility began to decline quite dramatically in January 2022, and its decline has not stopped since (see again Figure 1). It is therefore certain that sometime in the spring of 2021, another causal mechanism must have started to operate—one different from the voluntary change in behavior described above. In our opinion, the Covid vaccine is still the most plausible candidate (see the Introduction again). We thus hypothesize that the mRNA-based experimental vaccines prevented some women from getting pregnant.
One might argue that even this mechanism may be voluntary: Vaccinated women may only have postponed pregnancy due to recent vaccination. This would have resulted in a decrease in TFR about a year after the vaccine rollout (which is indeed observed) followed by an overshoot in TFR when the “postponed” babies would be born. However, no such rebound ever occurred. On the contrary, the TFR of Czech women never even returned to pre-pandemic levels – it has been decreasing by about 10% per year for the past 4 years.
So, some vaccinated women either decided they do not want children, or the vaccine prevented them from getting pregnant by some biological pathway. These two possibilities cannot be distinguished in observational data. The reader can decide which of the two is more plausible.
Conclusion
We have analyzed a unique individual-level database of reproduction events by Covid vaccination status which was briefly published (and subsequently taken down) by the Czech government. We found an extremely strong association between Covid vaccination and low fertility.
Most of the pattern can be explained by a change in the behavior of women – despite official recommendation, pregnant women tried to avoid the experimental vaccines. However, this effect could not have been the only causal mechanism at work as it would have left the total fertility rate of the entire population (regardless of vaccination status) unchanged. Since the TFR of Czech women started decreasing sharply in January 2022, some causal mechanism must have been at work in the spring of 2021. We hypothesize that the mRNA-based experimental vaccines prevented some women from getting pregnant.
Join the conversation:
Published under a Creative Commons Attribution 4.0 International License
For reprints, please set the canonical link back to the original Brownstone Institute Article and Author.