Since the beginning of the pandemic, we have been assured that community masking compliance would solve our problems and halt the spread of SARS-CoV-2. Yet real-world application data has consistently shown them to fail as a mitigation measure for personal protection, and instead of correcting course on the haphazard guidance that was doled out, we were told to mask harder with increasingly restrictive, albeit effectively non-mitigating apparatuses.
But why did they fail, and why do they continue to fail? Below, we delve into the specifics on why, even if assuming hypothetical perfect capture capacity, N95s fail to mitigate the spread of SARS-CoV-2.
We should begin by viewing viral transmissibility and output of infectious matter as spectrums, based on severity of illness, immune response of a given individual, and progress in the course of illness. These have all been shown to have significant impacts on the viral load of an individual infected with SARS-CoV-2. We will discuss output figures versus infectivity rates, and methods of measurement for minimum infective dose.
These are each important factors to consider in pathogenic mitigation even independently, but combined, they can show us specifically whether a given approach will have a desired outcome in the elimination of an infectious hazard. Output figures of respiratory emissions demonstrate how much matter is being expelled by an individual, and whether or not they are transmissible with a respiratory pathogen, but output figures vary greatly between more severe stages in onset of illness, recovery periods, and when PCR-negative for a given pathogen.
By comparing output with particle- to- plaque forming unit (PFU) ratios, we are given a rate of how many particles emitted are viable virions capable of causing infection. Each of these infectious units is referred to as a PFU. The number of PFUs required to be received by a potential host is given as a minimum infective dose (MID) figure, which is a threshold that once met, onset of infection is to be anticipated.
By looking at figures for particle- to- PFU ratio and calculating MID potential, the end product is the potential number of individuals who can be infected over a given period of time.
With this MID threshold for the potential of infectivity, we can then apply the hypothetical perfect capture capacity of a given apparatus to see whether the best- case scenario results in likelihood of the apparatus mitigating, or preventing MID threshold from being met for the hazard.
Here, we look at the output, particle- to- PFU ratio, and MID for SARS-CoV-2, versus the hypothetical perfect capture capacity for N95s, to demonstrate that even with a perfect rate of capture (and in this case, of matter far smaller than the apparatus is approved or designed to capture), the 5% percent never captured is still a plentiful enough potential exposure to infectious matter to result in infection.
Particle ranges and corresponding behavior of emitted matter
Pandemic mitigation measures should have begun with minimum viable particle size, which for SARS-CoV-2 falls at 0.06-0.14 µm. While frequently pushed by public health officials, N95s are solely rated and approved to capture matter greater than 0.3 µm. More than 90% percent of exhaled particulates have been shown to fall under 0.3 µm. This size of matter remains aloft for extended periods — hours, even days, depending on air exchange rates within the given space. SARS-CoV-2 has been shown to remain viable after hours as an aerosol outside of a host, and for days on surfaces.
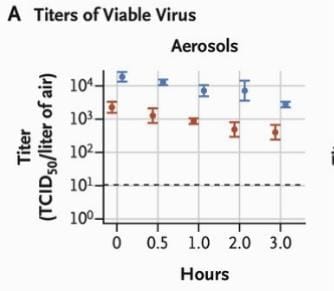
“The SARS-CoV-2 virus was observed to be viable for 3 hr. in aerosols, with decrease in infectious virus concentration from 103.5 to 102.7 TCID50 per liter of air.”
This study used lab-generated aerosols containing infectious SARS-CoV-2, and observed viability of emitted matter on different surfaces and as aerosols over time.
When considering the following, one also wonders if porous mask and respirator membranes and played a role in increasing the term of viability for viral matter:
“The survival times of airborne viruses on surfaces differ based on whether the surfaces are nonporous (e.g., plastic, stainless steel, glass) or porous (e.g., papers and clothes). Nonporous surfaces are major contributors to disease transmission since the survival times of airborne viruses on them have been observed to be much longer than those of porous surfaces.”
Masks and respirators certainly count as porous surfaces. Many respirators are also constructed of melt-blown plastics. Has viral viability on mask membranes been studied to a great enough extent?
Aerosol viability rates are important because they demonstrate the capacity for transmission in enclosed spaces without a transmissible individual present. With a transmissible individual present and emitting into the given space, output would be a constant, and viable viral matter would increase atmospheric saturation of the pathogen on a per-breath basis.
An overlooked yet critical issue with masks and respirators is the seal – small gap areas render these apparatuses ineffective for the wearer. Seldom, if ever, is anyone wearing these apparatuses correctly, under the necessary terms of wear, so we are met with already non-mitigating apparatuses being worn incorrectly.
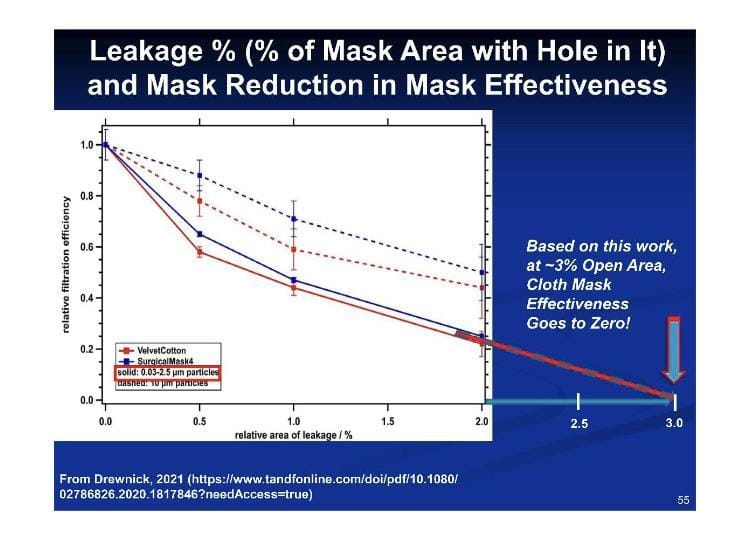
According to these figures for fit versus leakage, 3.2% percent leakage equates to 100% percent inefficacy.
These are all factors that must be considered when addressing the cause of an apparatus failing to mitigate a given hazard. By next examining emissions output, Minimum Infective Dose, Plaque Forming Units, and how they relate, we can better understand why engineering controls were always the correct response, not mass implementation of respiratory protection apparatuses.
Respiratory Emissions from “Sick” Patients – PCR-Positive versus Negative Test Results:
In research on aerosol output in healthy versus SARS-CoV-2 PCR-positive test subjects, 90%+ percent of emitted particulates by PCR-positive test subjects were under 0.3 µm, and counts of emitted matter were conducted comparing individuals with different severities of illness with PCR-negative subjects.
“The median exhaled particle count was highly significantly elevated in SARS-CoV-2 PCR-positive patients (1490.5/L [46.0–34,772.0/L]) compared with healthy controls (252.0/L [0.0–882.0/L]; p < 0.0001.”
If we use a respiratory emission rate of 4.3-29 liters per minute (from EPA Exposure Factors Handbook), the highest-output PCR-positive range of 34,772 particles per liter multiplied by 29 liters per minute is as high as 1,008,388 particles emitted per minute.
While I am not asserting that all of those particulates were individual virus particles, or viable virus particles for that matter, there is nevertheless a highly significant difference in the matter emitted by PCR-positive and negative individuals (median values of 1,490.5 vs 252). A ratio for converting particles to PFUs will be introduced after the role of PFUs is discussed.
Particle Sizes and Emission Rates:
The study previously discussed measures- emitted particle- size ranges in SARS-CoV-2 positive and negative subjects.
“Regarding the particle size distribution, the available size channels (in total, 14 size channels from 0.15 to 5.0 μm) were analyzed in across three size bands: <0.3 μm, 0.3–0.5 μm, and >0.5–5.0 μm. For both groups, the majority of the aerosols (>90% in the SARS-CoV-2 PCR-positive group and >78% in the -negative group) were found in the smallest range (<0.3 μm). Especially for the COVID-positive group, increases in total aerosol concentration were dominated by increases in particles ≤0.3 μm.”
Ten individuals from the 64 hospitalized patients sampled, who were among the most severe cases presenting, were responsible for around 64.8% percent of exhaled particle counts, so it is important in this case to look at least conservative output range and the potential for infectivity when running output and minimum infective dose calculations. Specifically, the paper stated:
“In the SARS-CoV-2 PCR-positive group, 15.6% (n = 10/64) showed high counts and were responsible for 64.8% of all exhaled particle counts in the group. Moreover, the 15.6%, equating to 3.5% of all patients (n = 10/288), was responsible for 51.2% of all exhaled particles.”
If we compare those experiencing the greatest severity of illness with rates of infectivity, we can understand more about viable particle output by transmissible individuals. Considering the low output of both emitted matter and virions by PCR-negative and recovering PCR-positive test subjects, it may be safe to speculate that it speaks to the low likelihood of asymptomatic transmission being a leading factor in viral spread.
The presence of RNA copies versus concentrations of viable virions
Not all RNA copies or virus particles are capable of forming PFUs resulting in viral replication. While data has been provided for how many infectious units are generated, this is not the emissions output rate. These are estimates on total viral production during an infection.
“Dividing by estimates for the inverse of the viral clearance rate gives an estimated total production of 3 × 10⁹ to 3 × 10¹² virions, or 3 × 10⁵ to 3 × 10⁸ infectious units over the complete course of a characteristic infection.”
Simplified, that is a total production of 3 billion to 3 trillion virus particles, or 300,000 to 300 million infectious units generated over the course of illness.
Virion output
There are different methods of establishing virion output, which offer slightly different ranges when viewed side- by- side. Some studies show total virions emitted, such as the following:
“Some patients have viral titers that exceed the average titer of Wölfel et al by more than two orders of magnitude thereby increasing the number of virions in the emitted droplets to well over 100,000 per minute of speaking.”
Other studies give total particle counts and rely on using conversion factors from total output to viable virions. What is important to establish is that overall virus particulate output does not equal total viable virions, meaning virions capable of creating Plaque Forming Units (PFU).
PFUs – Understanding virus particles needed to form individual Plaque Forming Units (PFU):
While all emitted viral RNA and virus particles are not capable of viral replication and the creation of PFUs, it is understood that each PFU is created by one viable viral particle. The following excerpts discuss the impact of PFUs on viral infections and onset.
“The assay is designed so that each plaque results from infection by multiplying a single infectious virus particle. As such, PFU/ml is considered a measure of the number of infectious units per milliliter (IU/ml), with the caveat that one cannot be certain of a one-to-one ratio of plaques to infectious particles in the applied aliquot.”
“For most animal viruses, one infectious particle is sufficient to initiate infection.”
“The linear nature of the dose-response curve indicates that a single virion is capable of initiating an infection. However, the high particle-to-pfu ratio of many viruses shows that not all virions are successful. A high particle-to-pfu ratio is sometimes caused by the presence of noninfectious particles with genomes that harbor lethal mutations or that have been damaged during growth or purification.”
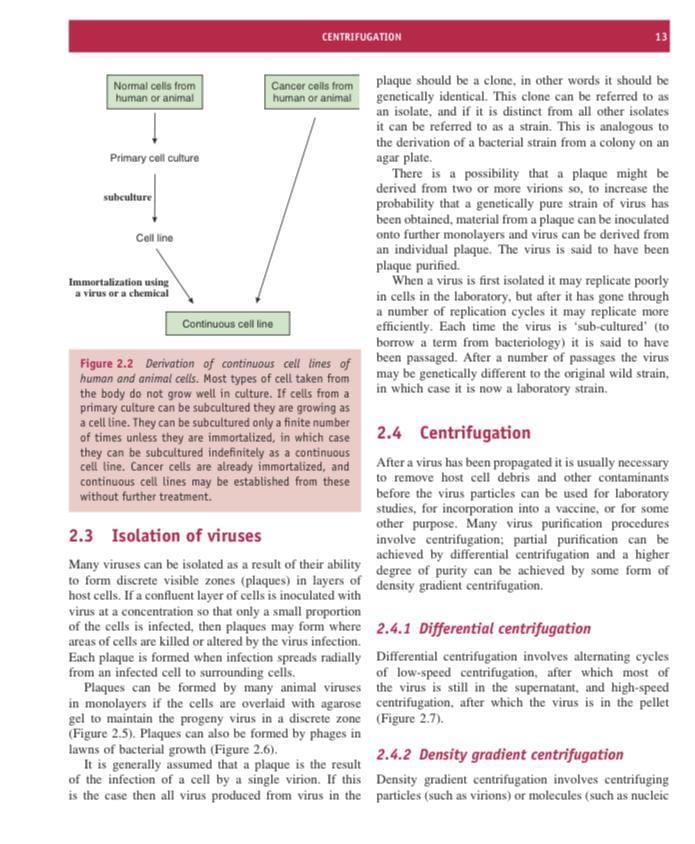
“It is generally assumed that a plaque is the result of the infection of the cell by a single virion. If this is the case then all virus produced from virus in the plaque should be a clone, in other words it should be genetically identical.”
To summarize, one viable viral particle, or virion, is capable of creating one PFU, in which this viral particle replicates. Some of the matter created is solely viral RNA incapable of independently causing infection, and some of the matter created is capable of replication and infection.
The relationship between the total output of particles and the creation of PFUs is called a particle to PFU ratio. For SARS-CoV-2, the ratio of emitted particles to PFUs is 1000 to 1,000,000.
PFU and Minimum Infective Dose Studies
Our breathing rate varies depending on age and level of activity. The average human respiratory rate is 16-20 breaths per minute. For purposes of this discussion, a breathing rate of 4.3-29 liters per minute (from EPA Exposure Factors Handbook) will be used. This reference gives a range of as high as 53 liters per minute. We will look into output as virions per minute, and minimum infective dose as PFUs and virions for transmission, as both are explored in available research.
Minimum Infective Dose (MID) Data from the Literature:
Comparison studies of different respiratory viruses and SARS-CoV-2 animal studies have been used to contribute to many MID estimates, but this paper focuses solely on human studies as much as possible.
“Although the MID of SARS-CoV-2 in humans needs more research, it is expected to be approximately 100 virus particles. The only human study regarding a coronavirus has been reported for HCoV-229E and its MID is 9 PFU. Furthermore, if aerosol transmission is the dominant mode, then the MID would be lower.”
“In fact, aerosol-based infections require less doses, e.g., ~100 times less than droplet-based infections.”
“The minimum infective dose of SARS-CoV-2 causing COVID-19 in humans in assessed cross-sectional and case-series studies was low; in a case-series study that investigated infective dose in 273 specimens from 15 SARS-CoV-2-positive patients, detected minimum infective dose was 1.26 PFU in vitro in the COVID-19-RdRp/Hel assay.1 In another study, 248 oro-nasopharyngeal samples of COVID-19 individuals were assessed, and infective dose was reported to be 364 PFU.”
“In a case-series study which assessed 97 children 10 years and lower, 78 children aged 11–17 years, and 130 adults, the infective dose in 11–17 years children was lower than two other groups (125 PFU). Children had lower live virus growth, higher cycle thresholds, and lower viral concentration in comparison with adults, so children are not the main carriers of infection. Children aged ⩽10 years were more likely to be asymptomatic than others.”
“One of the most well discussed one (sic) is the study done by Basu et al., the main goal of which was to evaluate the size of the droplets which have high probability of causing infection. But besides this finding, they also had some points related to the viral load which can cause the infection. They found that the number of virions placing at a closely situated individual’s nasopharynx over the 2.5 h duration approximates to (11/5) virions per minute × 60 min × 2.5 h = 330.”
Comparison studies including other Coronaviruses have shown that PFUs can be quite low for respiratory viruses.
“Estimated infectivity of SARS-CoV-1 was comparable to other coronaviruses including HCoV-229E, a causative agent for a mild cold in humans. ID10 and ID50 of SARS-CoV-1 were reported as 43 and 280 PFU (400 TCID50) in an experimental study.”
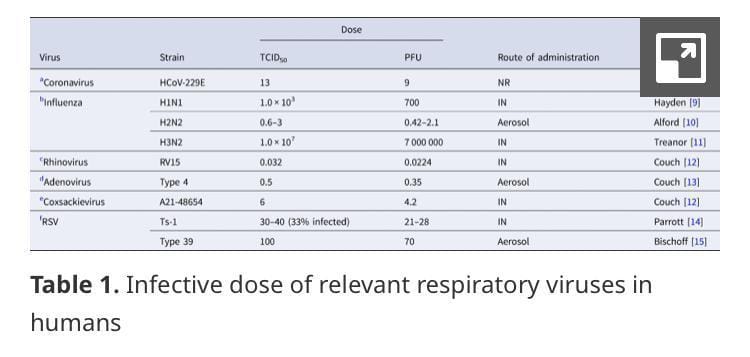
“The human ID50 for seasonal coronavirus subtype 229E that causes mild common cold in humans was reported to be 13 TCID50.”
The figures discussed in the provided studies on SARS-CoV-2 were 1.26, 100, 125, 330, and 363 PFU for transmission, speaking again to a broad spectrum of susceptibility.
Output of viable virions versus Minimum Infective Dose threshold potential
By using these available figures, we can tackle the assertion that N95s provide meaningful protective value from infectious aerosols by looking at output contributions, infectivity potential of emitted viral matter, PFU ranges, then we can weigh these ranges against a hypothetical perfect capture capacity of N95s capturing 95% percent of matter, versus the remaining uncaptured 5% percent. Again, note that N95s are not designed nor approved to capture <0.3 µm, and we are discussing a pathogen which has a minimum viable particle size of 0.06-0.14 µm.
Respiratory emissions from a transmissible individual have been shown to reach higher than 100,000 virions in one minute, though not all emitted virions can be assumed to be infective. Additional research papers have claimed an output as high as 750,000 virions/minute (but data supporting such claims is lacking). It should also be noted that we of course do not inhale all of an individual’s expired matter, but our proximity to a transmissible individual, their rate of output, duration within the space, and the ventilation within that given space are all factors that will have an impact on likelihood of transmission that cannot be expressed in a linear or predictable fashion.
In the study we explored above, the highest-output PCR-positive range was 34,772 particles per liter, with those emitting the highest ranges of output composing 64% percent of total matter emitted.
First, we will create an hourly output of each of these ranges, then apply particle- to- PFU ratio for each range of 1,000 to 1,000,000.
Output range A
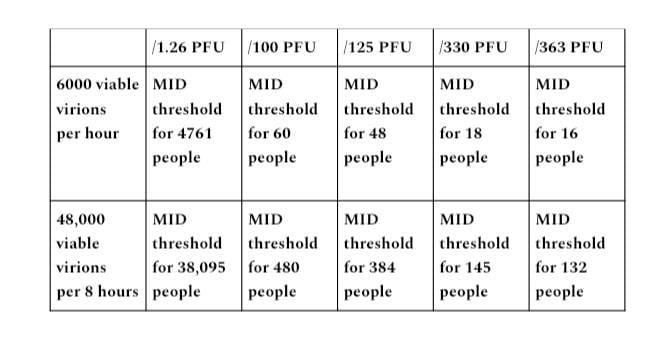
An hour of a transmissible individual in an enclosed space emitting 100,000 virions per minute would be an output of 6 million virions (100,000×60 minutes). An 8- hour period in an enclosed space equates to 48 million virions emitted (100,000×480 minutes). With the particle- to- PFU ratio of 1,000 to 1,000,000,, this gives us 6,000 viable virions in one hour, 48,000 in 8 hours.
The PFU figures from the discussed studies given were 1.26, 100, 125, 330, and 363 PFU required as minimum infective dose. I divided each quantity of viable virions by each PFU figure to get each potential for MID threshold listed.
Output range B
In the PCR-positive particle collection study, 34,772 particles per liter was the highest range collected, with ~64% percent of total particles emitted and counted coming from 10 sources who were among the most adversely affected by their infection with SARS-CoV-2. If we look at 34,772 particles multiplied by an emission volume of 29 liters per minute, the output range is as high as 1,008,388 particles emitted per minute.
The EPA Exposure Handbook lists a per-minute range as high as 53 liters per minute, so using a figure of 29 liters per minute is not the highest range of output possible. The output ranges of 7 and 29 liters per minute will be used because they are output ranges falling in sedentary to moderate activity level ranges.
At 29 liters per minute, multiplied by 34,772 particles per liter (1,008,388 particles), for a 60- minute duration of output, the product is 60,503,280 (1,008,388×60) particles per hour, and 484,026,240 per 8- hour period (1,008,388×480 minutes).
With a particle- to- PFU ratio of 1,000 to 1,000,000 for COVID, this gives us 60,503 viable virions emitted per hour, and 484,026 viable virions per 8- hour period.
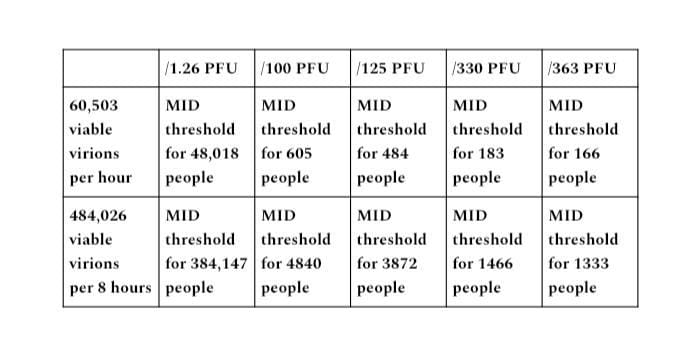
These calculations give us the output potential of a transmissible individual in terms of not only how many virus particles are emitted, but the potential for reaching MID threshold to infect a given number of people based on which PFU figure is used.
While the range of PFU demonstrated for SARS-CoV-2 is quite broad, we should anticipate a spectrum of transmissibility based on individual health status and immune response. While 1.26 PFU seems quite low, the PFU for SARS-Cov-1 has been shown to be as low as 13 PFU to meet MID threshold for onset of infection.
Even if a lower emissions output of 7 liters per minute is used, that gives a rate of 243,404 particles per minute (34,772 x 7)), 14,694,240 particles per hour (234,404 x 60), and 116,833,920 (243,404 x 480) particles per 8- hour period. With particle- to- PFU ratio of 1,000 to 1,000,000 applied, a 1one- hour period is an output of 14,604 viable virions, and 116,833 in an 8- hour period.
With these output ranges of sedentary to moderate intensity, many times the MID threshold is met for all established PFU figures.
Why N95s failed/are failing/will fail
Respirators with an N95 rating are designed and approved to capture 95% percent of non-oil-based matter greater than 0.3µm. SARS-CoV-2 has a minimum viable particle size of 0.06-0.14 µm, well under the 0.3µm threshold even if bound to larger matter, so this is a hypothetical of perfect capture capacity for a particle range that these apparatuses are not designed or approved to capture, nor has their application data shown them to perform at or near 95% percent.
For the purpose of an exercise in hypothetical perfect capture capacity, we will grant them an assumption of perfect 95% rate of capture. If we apply 5% of the MID figures demonstrated in to demonstrated in output ranges A and B, it will demonstrate the infectivity of viable virions versus the 5% percent never captured (e.g., no leakage) if a hypothetical 95% percent perfect rate of capture is met.
Output range A
Output range B
29 liters per minute
7 liters per minute
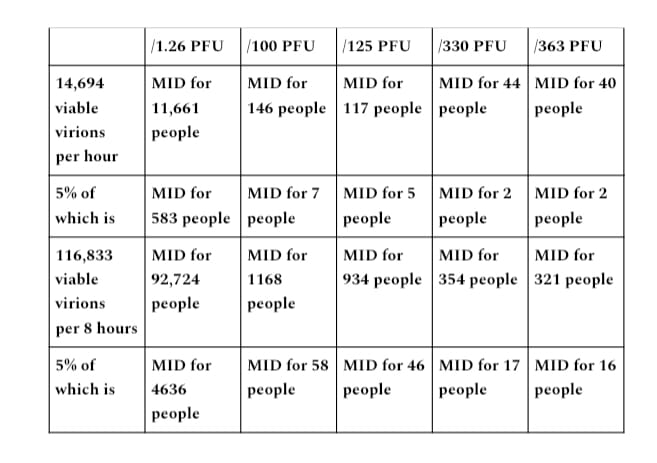
If we assume a hypothetical perfect capture capacity for N95s of particle size ranges of matter that these apparatuses are not designed or approved to capture, and apply the remaining 5% percent never captured, the vast majority of ranges of output versus PFU required to meet MID threshold still allow exposure for many times the MID threshold for potential infection of many individuals in 1- hour and 8- hour periods for each established range of output.
Summary
We became lax with our mitigation standards during the SARS-CoV-2 outbreak because this pathogen is not fatal for the overwhelming majority of people, with a survivability rate shown around 99.8% percent. This flippancy toward a hazard-specific response is incredibly dangerous when applied to deadlier pathogens and exposure elements.
By examining the hypothetical best-case scenario, we can better predict if a given measure will have a mitigating impact on the identified hazard. For N95s versus output, particle- to- PFU ratios, and MID for SARS-CoV-2, best-case scenario of hypothetical perfect capture of matter that these apparatuses are neither designed nor approved to capture shows them to still be non-mitigating for this hazard, and recommendations for their use should be immediately reconsidered.
Additional resources:
Discusses average viral load from samples: https://www.nature.com/articles/s41586-020-2196-x.
Minimum Infective Dose
https://www.ncbi.nlm.nih.gov/pmc/articles/PMC7090536/ (on MID in general, not SARS-CoV-2 specific).
Glossary
aerosol – particles dispersed in air or gas, defined as less than 5 microns in size.
asymptomatic (spread) – the theoretical concept of transmitting a pathogen to others while not exhibiting any established symptoms of said pathogen.
atmospheric saturation – the amount of viable matter that remains aloft within an enclosed space.
emissions – exhaled respiratory matter.
laminar flow regime – fluid particles following smooth paths in layers.
minimum infective dose – the minimum amount of a hazard one must be exposed to in order for onset of illness to be anticipated.
N95 – a non-oil-capturing particulate filtering respirator capable of blocking up to 95% of matter over 0.3 µm.
onset – the beginning of an illness taking hold once minimum infective dose threshold has been met.
output – the emissions being released into a given environment by a transmissible individual.
output as a constant – an individual within an enclosed space emitting infectious particle-laden respiratory aerosols into the given atmosphere, saturating the given atmosphere more with infectious matter with each breath.
particle to PFU ratio – a ratio for pathogenic output calculations that weighs the total number of particles emitted against the particles that are viably infectious.
PCR-negative – a given test subject does not receive a positive test result when tested with PCR methodology for a given pathogen. PCR stands for using the polymerase chain reaction technique.
PCR-positive – a given test subject receives a positive test when tested using the polymerase chain reaction technique for a given pathogen.
perfect capture capacity – capture of hazardous matter at a matched percent efficacy given by a product as its hypothetical best rate possible.
Plaque Forming Units (PFUs) – the creation of PFUs require one virion infecting a host cell, where viral replication begins. A threshold of a given number of PFUs is required for onset of illness, known as the minimum infective dose.
RNA copies – genetic material required to make copies of proteins within a cell. RNA copies do not equate to viable virions capable of replication.
TCID50 – an abbreviation for tissue culture infectious dose, which is the dilution of a virus required to infect 50% of cells in a culture assay.
viral load – the amount of virus particles in a given substance, emission, or within the body of a transmissible individual.
viral viability – virions capable of infecting a cell and creating plaque forming units (PFUs).
virion or viable virion- a complete infectious virus particle.
Join the Conversation
Published under a Creative Commons Attribution 4.0 International License
For reprints, please set the canonical link back to the original Brownstone Institute Article and Author.