
Downplaying. That has been a handy weapon against anything that threatened the official Covid narrative. Downplaying skeptical voices, downplaying uncertainties, downplaying contradictory data.
I recently described a typical example of the latter from Denmark. Here is another one, from Israel, which gives us a dual opportunity: First, to look at the rate of significant adverse events after the booster dose, as reported in a government-initiated survey. Second, to observe the language the anonymous author(s) used to describe the data. Released long ago but not published in a medical journal (yet?), the summary was written in Hebrew and contained 26 slides. I tried to offer a precise translation of the selected text.
The topic of the survey is called “reported phenomena,” which is not a complete phrase for “reported side effects” (Figure 1). Just like in English, an adjective is usually added to indicate the presumed link to a drug or a vaccine.

The authors are aware of under-reporting of side effects, although it is not clear how they infer under-reporting from reported data (Figure 2).
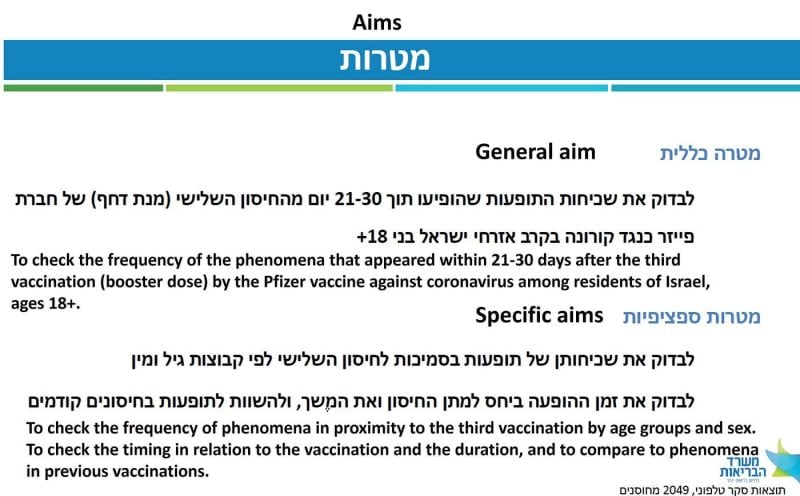
The aims of the survey are clearly stated (Figure 3). In brief, it was a random sample from the database of the Ministry of Health, excluding people without a listed phone number (understandable) and those who had had Covid (why?). Participants were vaccinated 21–30 days before a structured phone interview, conducted 2–3 months into the booster campaign.
Slightly over 2,000 people completed the interview, evenly split by sex. I am not sure why the sample size was not much larger, say, 20,000, closer to the vaccine trials. Lack of importance of the topic? Lack of resources in a country that served as a Pfizer laboratory? Downplaying unfavorable rates as imprecise (a small sample)?
Sampling ensured three equal-size age groups, which means that the age distribution of the sample did not necessarily match the age distribution of the vaccinated population. Although age-specific rates were sometimes presented, a weighted rate for the entire population was not.
Two to three months later, a follow-up interview was conducted with 45 of 59 women who reported changes in menstruation after the booster. We’ll return to this part later.
Survey results are influenced not only by reporting accuracy but also by the response rate, which can be defined in more than one way. It was around 50 percent by one definition.
To estimate a range for the rate of selected side effects, I will make two opposite assumptions about non-participants, which favor the vaccine. The first one is extreme.
- No side effects would have been reported by non-participants, so any observed frequency should be divided by 2. You may also view this “correction” as accounting for coincidental events.
- Unobserved rates in non-participants would have been identical, so any observed frequency is correct.
I am excluding the possibility that non-participants would have reported side effects at higher frequency than participants, again to favor the vaccine (a conservative approach).
A short preamble before showing data: Vaccines are given to mostly healthy people who do not present themselves as care-seeking patients. Therefore, the standards for “safe” are much more stringent than those for treatment of sick patients. In either case, Primum non nocere (first, do no harm) should be a governing principle.
Now, the data.
First, a vaccinee should have been lucky to escape side effects (Figure 4), some of which have been classified by official voices as reactogenicity. Occasionally, that was a promotional public health message for Covid vaccines: It means that the vaccine is working! For some reason, it has never been a promotional message for the flu vaccine.
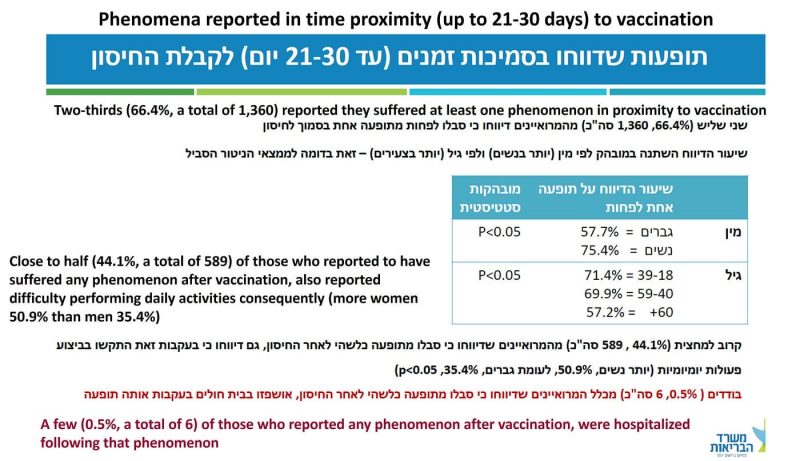
In almost 30 percent of the sample (589/2,049), or about 15 percent under the most conservative assumption, the side effect was severe enough to have caused difficulty in daily activities. Read the last sentence again and imagine that the culprit was a new mRNA-based flu shot. Going grocery shopping? Get your flu shot here for free and a good chance to spend a few days in bed, or off work!
More important, hospitalization after vaccination should be extremely rare, perhaps in the single-digit range per million or so. That used to be called a safe vaccine. The rate in this sample was 6/2,049 or 150–300 per 100,000 (my conservative range).
How good is this small-sample estimate?
Since hospitalization follows a serious adverse event, we may check concurrence with the latter. A solid analysis of the randomized trial of the Pfizer vaccine estimated 18 serious adverse events per 10,000 (180 per 100,000) above the placebo group. By and large, 150–300 hospitalizations per 100,000 is a comparable range.
To grasp the magnitude of these rates, consider 7,000–15,000 hospitalizations in Israel; 60,000–120,000 in the UK; and 200,000–400,000 in the US.
That does not fit the standards for a safe vaccine, even before considering vaccine-related deaths. And there were deaths, unless one assumes that all reported fatalities in every monitoring system are false. In Israel, the booster fatality rate was estimated at 8 to 17 per 100,000, perhaps 200 to 400 deaths.
How do the authors report the hospitalization data (Figure 4 above)?
“A few (0.5%, a total of 6) of those who reported any phenomenon after vaccination were hospitalized following that phenomenon.”
It is unclear if the red font was used to emphasize reassurance or concern. I translated the first Hebrew word to “a few” (neutral) but it might be closer to “few” (reassurance).
Either way, the truth is simple: if the vaccine were safe, we should not have observed any related hospitalization in a sample of 2,000. To observe six instead of none, by the play of chance, is a fictional proposition.
Adverse events were divided between local, at the injection site, and “general” (exact translation), some of which should be called “systemic.” About half of the respondents reported at least one general side effect, the most common of which were weakness/fatigue (42 percent), headache (26 percent), muscle/joint pain (25 percent), and fever above 38.0 C (15 percent). Of note, 5 percent reported chest pain. These are significant percentages even if divided by 2.
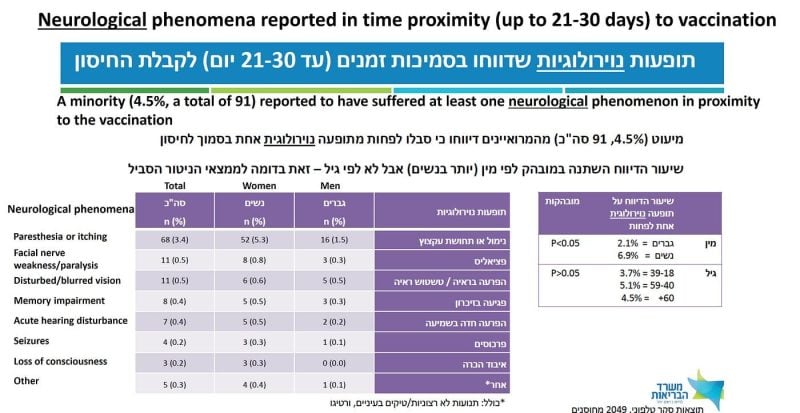
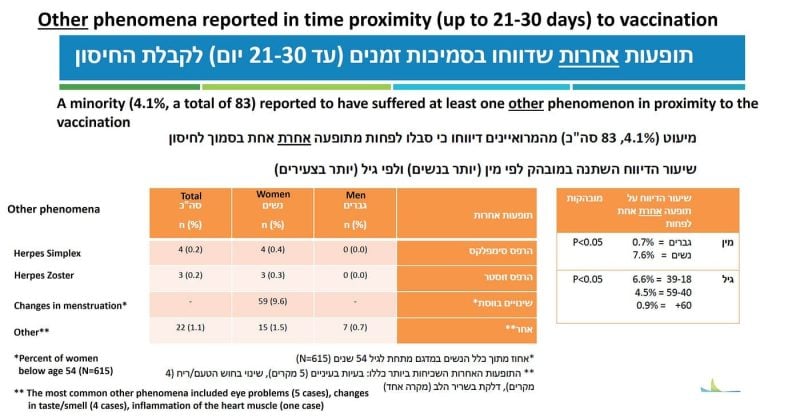
The authors reassuringly tell us that “a minority (4.5%, a total of 91) reported to have suffered at least one neurological phenomenon in proximity to the vaccination” (Figure 5). That it was not a majority is good news, but this minority corresponds to 2–5 vaccinees per 100, under my conservative assumptions. In almost half of the cases, the side effect was still present on the date of the interview.
It is impossible to understand the mindset of public health officials who consider such frequencies acceptable for mass vaccination of healthy populations against a disease that is about as risky as the flu until around age 60, and in the healthy elderly. Perhaps coronaphobia has not spared them either.
Three slides present data on changes in menstruation. I still remember how this worrisome side effect — indicating altered hormonal status and systemic dissemination of mRNA-containing lipid nanoparticles — was downplayed at the beginning. Early anecdotes, mostly reported on social media, have sent a clear message: Pregnant women should not be vaccinated. It was ignored.
Evidently, the risk in pregnancy was well understood by those who quickly launched post hoc reassurance research, which has no merit. Nothing can assure a logical-moral mind that interference with hormones during a normal pregnancy meet the criteria of safe and ethical conduct.
The frequency of changes in menstruation was computed from a sample of 615 women ages 18–53 (Figure 6). About 10 percent of the women (5-10 percent under my conservative range) reported some abnormality. Almost 90 percent of them reported regular menstruation before vaccination, which means that in most cases it was not misattributed. In half of the women, the abnormality persisted at the time of the follow up interview. Perhaps they will have another follow-up to tell us the frequency of prolonged or permanent abnormality after a third dose. Perhaps not.
There is a wider, troubling perspective of these data. We can be certain that the vaccine reached the ovaries, and disturbed a delicate balance of female hormones, because the clinical consequences were immediate. What about other organs? There is no reason to assume that mRNA-containing lipid nanoparticles spared all other organs, and if so, what might be the long-term consequences? That they can damage blood vessel walls is already known.
Last but not least, there was one reported case of myocarditis (Figure 6, footnote), which might have been one of those six hospitalizations. Not every case of myocarditis is diagnosed, so we cannot exclude one or more subclinical cases in the sample. If the vaccine were safe, we should not have observed any case of myocarditis in a sample of 2,000. Anyway, by now it is a widely accepted side effect, downplayed by claims about Covid-related myocarditis.
Five conclusions were listed on the last slide. Let me end with a translation of the last one, often considered the take-home message:
“In the majority of those who reported phenomena of any kind, the presentation after the third dose was not more severe in comparison with previous vaccinations.”
I contemplated several responses to this reassuring message, but perhaps none is needed.
Reposted from the author’s Substack
Join the conversation:
Published under a Creative Commons Attribution 4.0 International License
For reprints, please set the canonical link back to the original Brownstone Institute Article and Author.