Yes, inflation is taking its toll on the ballyhooed consumer. The figures for retail and food service sales released this AM for April left nothing to the imagination, falling by nearly 3 percent in inflation-adjusted terms from the level of April 2021. Two years of spending contraction hardly amounts to evidence of a “strong” consumer.
Of course, the latter figure is not much of a benchmark, either, since it reflected the tail-end of 12 continuous months of madcap Covid stimmies. The latter pumped upwards of $4 trillion into household bank accounts via—-
- Washington’s $930 billion of stimmy checks for 90 percent of the public;
- $900 billion of generous benefit toppers of $600 per week and other UI coverages;
- $800 billion of so-called PPP checks to small businesses and boot-strapping entrepreneurs;
- hundreds of billions of forced savings owing to the government-ordered closure of bars, restaurants, gyms, movies, sports arenas, malls etc
- additional hundreds of billions of relief from contractual loan and rent payments enabled by the government ordered moratoriums.
Owing to this tsunami of cash, of course, the April 2021 retail spending level was something to behold, even when you wring out the inflation. Real retail and food service sales that month were up by a stunning 46 percent from the previous April! There is nothing remotely like it as far back as retail sales were collected.
At the same time, the Lockdown bottom of April 2020 was one of a kind as well, reflecting a 21 percent decline from the pre-Covid level posted just two months earlier in February 2020. By way of comparison, the real retail sales drop during the Great Recession was just 13.5 percent.
The retail sector has been whipsawed in a manner that is literally off the charts of history, meaning that all the usual trend lines embedded in the historic data have been thrown into a cocked-hat. So it is more than a fair bet that normal month-to-month incremental gains are highly unlikely to occur after three years of violent turmoil in the base.
Inflation-Adjusted Retail Sales, 2007 to 2023
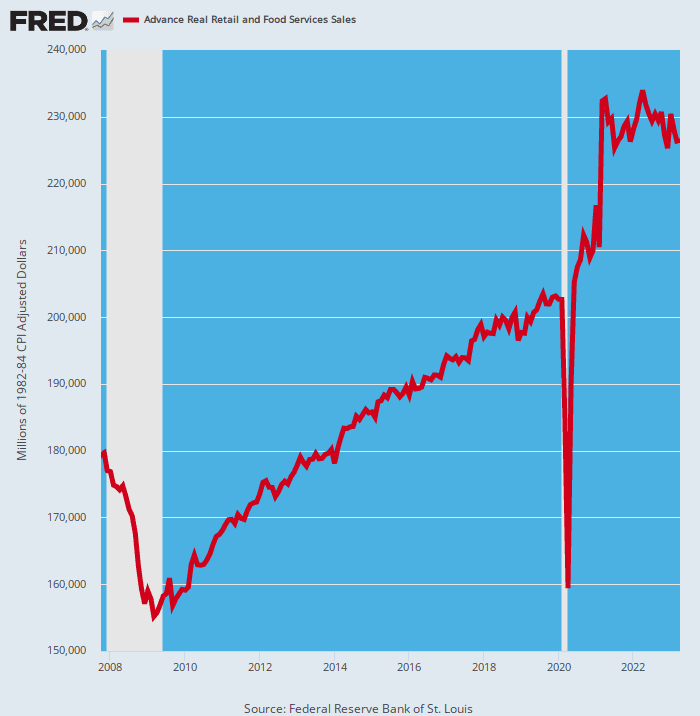
It is useful to examine the period between the pre-crisis peak in November 2007 and the February 2020 pre-Covid top. The trend line between those two points as depicted above is pretty continuous and smooth, and computes to a 1.0 percent per annum gain over the 12-year period.
Had that continued through April 2023, real monthly retail sales would have posted yesterday at $209.2 billion. Sales for the month were actually 8.3 percent higher at $226.4 billion, meaning that the pancaking pattern since April 2021 is likely just getting started.
In a word, the consumers’ dresser drawers, pantries, garages, cellars, and rented storage facilities got overly stuffed with inventories during the goods-buying sprees of the Lockdown and stimmy period, but are now being slowly drawn down and normalized.
As it happens, however, the retail sales and GDP numbers do not incorporate inventory gains and drawdowns at the end use/consumer level. These fluctuations are ordinarily not that important and show up as tiny wiggles in the the ebb and flow of the monthly sales rate.
Not this time, however. The good folks in Washington and their henchmen at the Fed unleashed what amount to small economic earthquakes beneath the foundation of consumer spending. That’s why consumer stalwarts like Home Depot are now surprising to the downside after several years of overperformance.
Thus, yesterday Home Depot reported its biggest revenue miss in more than 20 years and slashed its outlook for the year, reflecting the fact that households are delaying large projects and buying fewer big-ticket items like patio sets and grills. This is but the latest sign that consumers have maxed out their credit cards after splurging on Weber grills, hot tubs, and patio sets during the pandemic years.
Indeed, the yo-yoing shown above for overall retail sales was also evident in the quarterly pattern for the Home Depot behemoth which has annual sales of $158 billion per year. Accordingly, the company’s sales growth pattern was as follows at annualized rates:
Annualized Nominal Sales Change:
- January 2016 to January 2020: +5.3 percent;
- January 2020 to April 2021: +35.0 percent;
- April 2021 to April 2023:-0.33 percent
Actually, during the April quarters comp store sales fell by -4.5 percent, wiping out all the gains since the stimmies ended in April 2021. And when those nominal sales figures are adjusted for inflation, Home Depot’s real sales have actually shrunk nearly 12 percent since the stimmy peak two years ago.
Nor is this trend likely to reverse. In fact, management expects that shrinkage to continue, with comparable sales expected to decline between 2 and 5 percent this fiscal year compared with last year. That’s nearly double-digit shrinkage in real terms at the going 6 percent inflation rate.
So as we said, inflation is taking its toll. At the same time, the Fed’s belated campaign to bring it to heel has shown only modest success thus far. As of April, the year-over-year rise in our trusty 16 per ent trimmed mean CPI was still 6.1 percent, down only a tad from the 7.3 percent peak last September.
Y/Y Change In 16 Percent Trimmed Mean CPI, 2012 to 2023
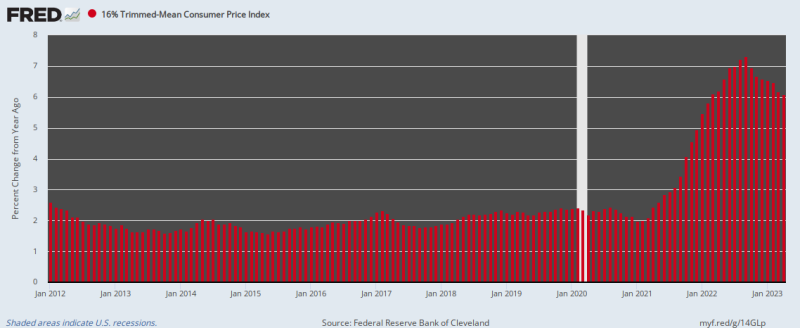
And remember, the April rate of change means that the purchasing power of the dollar would be cut in half every 11 years. So the Fed has an enormous amount of wood to chop, notwithstanding the relentless wishful thinking of Wall Street perma-bulls, who are now beating the “pause” tom-toms ever more loudly.
Thus, said one Joachim Klement, head of strategy, accounting and sustainability at Liberum Capital.
“Now that we have sufficient clarity on central bank policy and are close to the rate hike cycle peak, investors are looking for clarity on the political front before the coming earnings season.”
We’d say, no way on either front. The debt ceiling crisis is now the permanent condition of the nation’s fiscal governance because there is simply no political will to take on spending where it counts. That is, the $1.3 trillion national security budget and the the doomsday machine embodied in the automatic expenditures for the entitlements and mandatory spending accounts.
These latter accounts including interest on the spiraling public debt will total upwards of $60 trillion over the next 10 years or 88 percent of total non-security state spending. Nor is the GOP and a goodly share of the Dems about ready to walk the plank for tax increases, either.
So either Grandma Yellen will be forced to allocate available receipts to debt service and priority programs, as we amplified yesterday, or the GOP will capitulate still again and settle for phony out-year spending cuts that will never really see the light of day.
But regardless of which route the current standoff eventually takes, one thing is certain: There will be another debt ceiling crisis next year, the year after that, and every year thereafter as far as the eye can see.
In a word, American fiscal governance is broken and broken badly. Owing to the Fed’s massive monetization of the public debt over last several years Washington has lost all sense of the economic costs and consequences of massive borrowing. And that’s because there has been no “crowding out” and no spiraling interest rate signals from the bond pits of the type which historically kept Washington pols close to the fiscal straight and narrow.
But as we also said yesterday, the monetization route has now been exhausted because the resulting financial bubbles on Wall Street and inflation on main street have finally forced the Fed to idle its printing press, and to begin shrinking its elephantine balance sheet at a $1.1 trillion annualized rate (QT).
And that means, in turn, that there will be no rate-cutting in the money markets and no collapse of yields in the bond pits any time soon. A prospective call on available funds at a $3 trillion annual rate (new Treasury debt plus QT) will insure that rates creep steadily higher.
Finally, as we also indicated yesterday, the reason this tightening cycle is not nearly over is because the financial system is water-logged with excessive liquidity. Until that vast sea of cheap credit is liquidated the Fed will be fighting a rearguard battle against inflation.
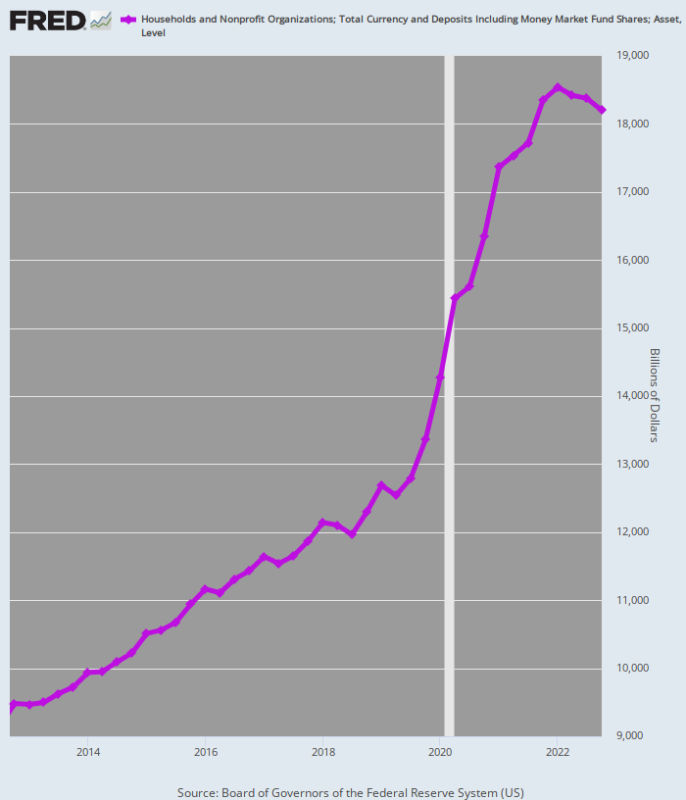
The chart below gives some indication of the magnitude of the liqudity flood that must now be liqudiated throught tighter monetary conditions for an extended time period. To wit, between Q4 2012 and Q4 2019, total household cash balances rose at a steady 5.0 percent annual rate, just a hair above the growth rate of nominal GDP.
However, due to the stimmy bacchanalia commencing in March 2020, the rate of cash build-up in household accounts quadrupled to 20.0 percent per annum between Q4 2019 and the stimmy peak in Q2 2021.
That gain amounted to $4 trillion in a relative heartbeat and is what set the inflationary fires ablaze.
Since the peak in Q2 2021, the growth rate of household cash balances has plunged to just 2.5 percent per annum. But that is just the beginning. During recent quarters this massive hoard of cash has begun to shrink, but it will take years to bring it back to normalcy.
For example, at the pre-pandemic rate of 5.0 percent growth, household cash balances by Q4 2022 would have totaled $15.47 trillion. In fact, the actual figure was $18.20 trillion, implying that stimmy-fueled excess cash balances may exceed $2.7 trillion.
Needless to say, all that extra cash is drastically compounding the Fed’s anti-inflation campaign because it will continue to provide household spending power even if the Fed’s rate hikes succeed in slowing current income growth. That is to say, the Fed’s reckless inflationary policies of earlier years still hang over the economy like a wet blanket, insuring that the eventual recessionary fix will be far harsher than now expected by the perma-bulls.
If nothing else, this massive household cash overhang guarantees that the Fed’s printing presses will stay on idle for years to come. So the great money printing party is now over and done on both ends of the Acela Corridor.
And none too soon!
Household Cash Balances, 2012-2022
Reprinted from the author’s paid service. He also has a Substack.
Join the conversation:
Published under a Creative Commons Attribution 4.0 International License
For reprints, please set the canonical link back to the original Brownstone Institute Article and Author.