[Editor’s note: this article is reprinted from David Stockman’s ContraCorner, which offers such analysis daily to subscribers. Pound-for-pound, Stockman’s daily analysis is the most comprehensive, salient, insightful, and data-rich of anything available today. His decades of experience in both finance and policy, and his principled and legendary commitment to revealing the unvarnished truth and demonstrating his claims with data, is daily on display. Brownstone is proud that Stockman also serves as a senior scholar, and he graciously permits periodic republishing here.]
The Biden Administration’s utterly ridiculous plan to enact a three-month holiday from the 18.4 cents per gallon Federal gas tax should be a wake-up call with respect to a far broader and more destructive threat. To wit, the US economy has lost its market-based bearings and is now behaving like a spasmodic heap of discord, dislocation and caprice owing to repeated batterings via out-of-this-world government regulatory, fiscal and tax interventions.
In combination, the Green Energy attacks, the Virus Patrol’s lockdowns and scare-mongering, the Fed’s insane money-pumping and Washington’s unprecedented $6 trillion fiscal bacchanalia of the last two years have deeply impaired normal economic function.
Accordingly, the business sector is flying blind: It can’t forecast what’s coming down the pike in the normal manner based on tried and true rules of cause and effect. In many cases, the normal market signals have gone kerflooey as exemplified by the recent big box retailers’ warnings that they are loaded with the wrong inventory and will be taking painful discounts to clear the decks.
Yet it is no wonder that they stocked up on apparel and durables, among others, after a period in which the Virus Patrol shutdown the normal social congregation venues such as movies, restaurants, bars, gyms, air travel and the like. And than Washington added fuel to the fire by pilling on trillions of spending power derived from unemployment benefits that reached to a $55,000 annual rate in some cases and the repeated stimmie checks that for larger families added up to $10,000 to $20,000.
Employed workers didn’t need the multiple $2,000 stimmie checks because in its (dubious) “wisdom” the Virus Patrol forced them to save on social congregation based spending.
Likewise, temporarily laid-off workers didn’t need the $600 per week Federal UI topper. For the most part they had access to regular UI benefits, and also suffered forced “savings” via the shutdown of restaurants, bars, movies etc. Even the so-called “uncovered” employees not eligible for regular state benefits didn’t need $600 per week of UI bennies. The targeted temporary coverages could have paid 65% of their prior wage for well less than $300 per week on average.
So what happened is that the double whammy of forced services savings and the massive flow of free stuff from Washington created a tsunami of demand that sucked the inventory system and supply chains dry.
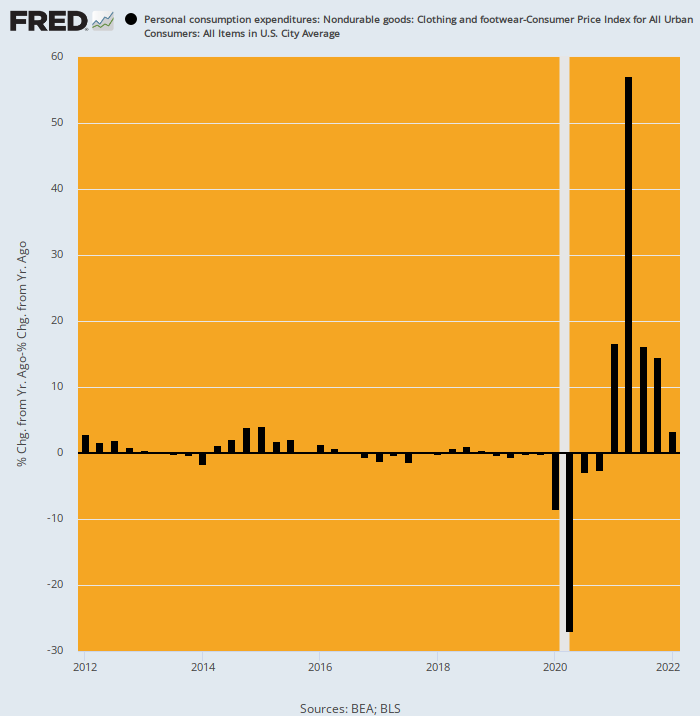
For instance, here is the Y/Y change in inflation-adjusted PCE for apparel and footwear. The steady-state condition of the US economy for that sector oscillated right near the flat-line during 2012-2019.
Then the Washington policy hurricanes hit. During the original Q2 2020 lockdowns, real spending for apparel and footwear plunged by -27.0%, as Dr. Fauci and the Scarf Lady sent half of the American public scurrying for the fetal position in their bedrooms and man-caves.
But it didn’t take the American public long to get the joke. They soon re-cycled their restaurant spending etc. and topped it up with a tsunami of Washington’s free stuff during the 18 months ending in September 2021. That literally turned spending patterns upside down.
That is to say, the Amazon delivery boxes were declared “safe” once the CDC figured out that the virus didn’t pass on surfaces—so the public went nuts ordering apparel and footwear. By Q2 2021, especially after Biden idiotic $1.9 trillion American Rescue Act in March 2021, the Y/Y change had violently reversed to +57.1%.
That’s whip-saw with malice aforethought. Left to their own devices consumers would never yo-yo their budgets in this manner, meaning, in turn, that retail, wholesale and manufacturing suppliers had no possible way to rationally cope with the Washington-fueled supply-chain upheavals.
As is also evident from the chart, the inflation-adjusted Y/Y change in May plunged nearly back to normal—just +3.4%. Yet it will take years for supply chains and inventory levels and mixes to recover from the economic chaos generated by Washington.
Y/Y Inflation-Adjusted Change PCE for Apparel And Footwear, 2012-2022
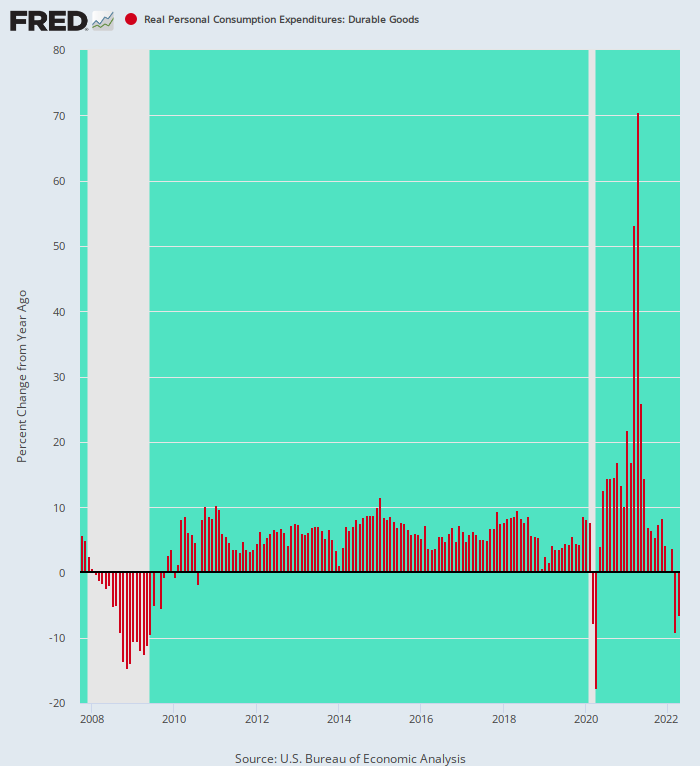
The same story holds for durable goods—with the yo-yo amplitude even more extreme. As shown by the chart below, the trend level of growth in real PCE for durables was 3.3% per annum during the 14 year period between the pre-crisis peak in October 2007 and the pre-Covid top in February 2020. Other than during the 2008-2009 recessionary contraction, the numbers followed a stable pattern that businesses could cope with.
And then came the Washington ordered whipsaws. During April 2020 real PCE plunged by -17.5%from prior year, only to violently erupt by +70.5% Y/Y in April 2021. Those stimmies and forced “savings” again!
But now that’s over and done. During May 2022 the Y/Y change was -9.1%. Again, it is no wonder that businesses have the wrong inventories and supply chains have been monkey-hammered from one end of the planet to the other.
Y/Y Change In Real PCE Durables, 2007-2022
In fact, that points to another dimension of the bull-whip story. To wit, the one time conversion of manufacturing to the global supply chain had a hidden vulnerability—-ultra JIT (Just-In-Time).
That is to say, when shipping distances for goods went from 800 miles within the US to 16,000 miles (from factories in Shanghai to terminals in Chicago (or 68 days at sea), a prudent system would have built-in large amounts of redundant inventory to safeguard against the the sweeping disruptions of the past two years.
But the carry-cost of in-depth inventory redundancy would have been extremely costly. That’s owing to working capital costs and the risk of stockpiling the wrong-mix of goods. That is, potential inventory costs and merchandise discounts and write-off would have eaten heavily into the labor arbitrage.
But fueled by the Fed easy money and idiotic 2.00% inflation target, supply chains became ever more extended, brittle and vulnerable. That fact is now indisputable.
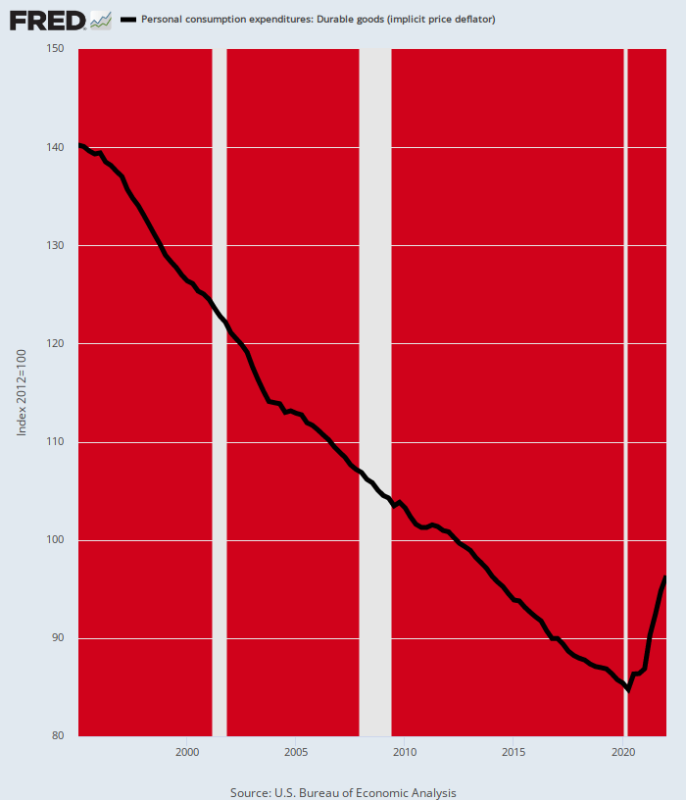
As it happened, however, the push to ultra-JIT supply chains caused a massive one-time deflation of durable goods costs. In fact, the nearly 40% contraction of the PCE deflator for durables between 1995, when the China export factories first cranked-up, and the pre-Covid level of early 2020 is one of the great aberrations of economic history.
We seriously doubt that the black line below actually happened, save for the BLS endless fiddling with hedonics and other adjustments to the CPI. Yes, toys, for instance plunged by upwards of 60% during this 25-year period, but then again did they make a whopping big negative hedonics adjustment to accounts for the China junk toy standard?
Still, the deflationary free ride is over. Already, the durables deflator is up nearly 13% from the pre-Covid low and there is far, far more ground to recoup as global supply chains rework the busted JIT models that evolved prior to 2020.
PCE Deflator for Durable Goods, 1995-2022
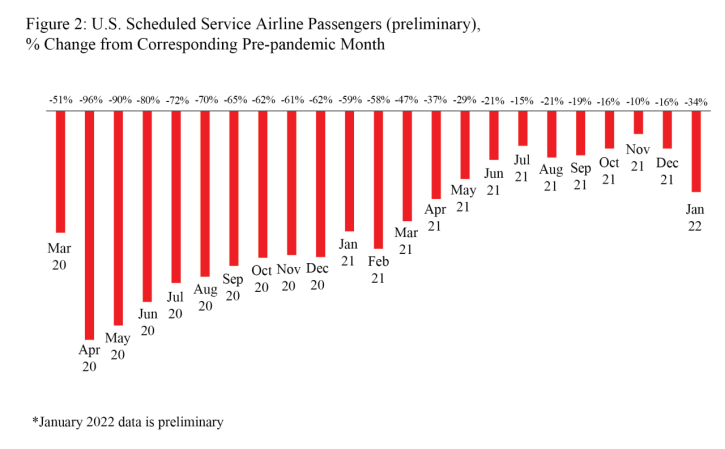
When it comes to Washington-induced whipsaws, however, there are few sectors that have been as battered as the air travel system. During April 2020, for instance, passenger boardings were down a staggering 96% from the corresponding pre-pandemic month, as in dead and gone. Moreover, this deep reduction pattern prevailed well into the spring of 2021.
The airline shutdowns were not necessitated by public health considerations: Frequent cabin air exchanges probably made them safer than most indoor environments.
But between the misbegotten guidelines of the CDC and the scare-mongering of the Virus Patrol, even as late as January 2022 loadings were still down 34% from pre-pandemic levels.
The industry’s infrastructure got clobbered by these kinds of operating levels. Baggage handlers, flight attendants, pilots and every function in-between suffered huge disruptions in incomes and livelihoods—-even after Washington’s generous subsidies to the airlines and their employees.
And then, insult was added to injury when pilots and other employees were threatened with termination owing to unwillingness to take the jab. The result was an industry to turmoil and sometimes even ruin.
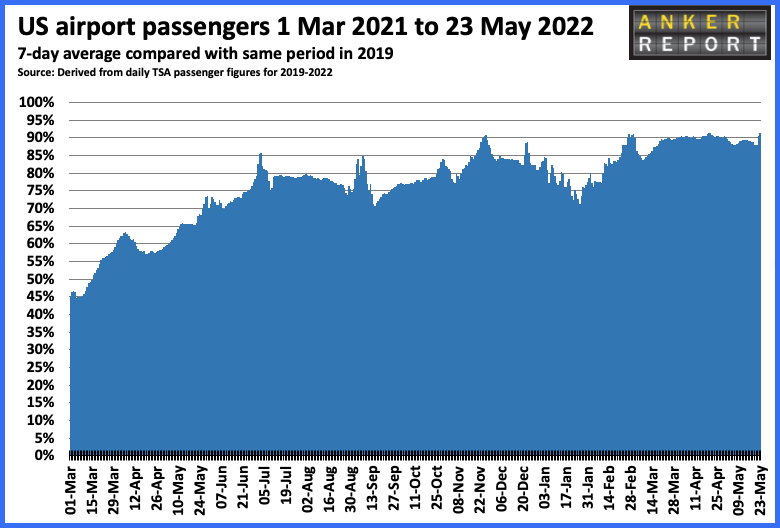
Then the traffic came flooding back. From 70% of pre-pandemic levels in mid-winter 2021-2022, boardings have subsequently rebounded to 90% in recent months. Alas, the air travel system is severely disorganized with labor shortages of every kind imaginable, leading to schedule gaps and cancellations like rarely before.
And now the whipsaw is in the inflationary direction as desperate passengers pay previously unheard of prices to get scarce seats during the summer travel months.
As CBS News recently reported,
Airlines cancelled nearly 1,200 U.S. flights on Sunday and Monday, leaving passengers stranded and luggage piled up at airports across the the country. Thousands more trips were scrapped across the globe as the summer travel season kicks off.
Now for the bad news: Airline analysts say delays and cancellations are likely to persist, and could even get worse.
“We may not have seen the worst of this,” Kit Darby, founder of Kit Darby Aviation Consulting, told CBS MoneyWatch.
Right now, when you have normal things like airplane maintenance or weather, delays are much more severely felt. There are no reserved extra pilots, planes, flight attendants — and the chain is only good as the weakest link,” Darby said.
Many of these problems stem from airlines slashing staff early on in the pandemic, when air travel plummeted. Demand has since roared back faster than airlines have been able to ramp up hiring.
“The biggest issue is they don’t have the capacity. They have not been able to bring back full capacity in terms of pilots, TSA checkpoints, vendors at the airport, baggage handlers, ground staff or flight attendants,” New York Times travel editor Amy Virshup told CBS News.
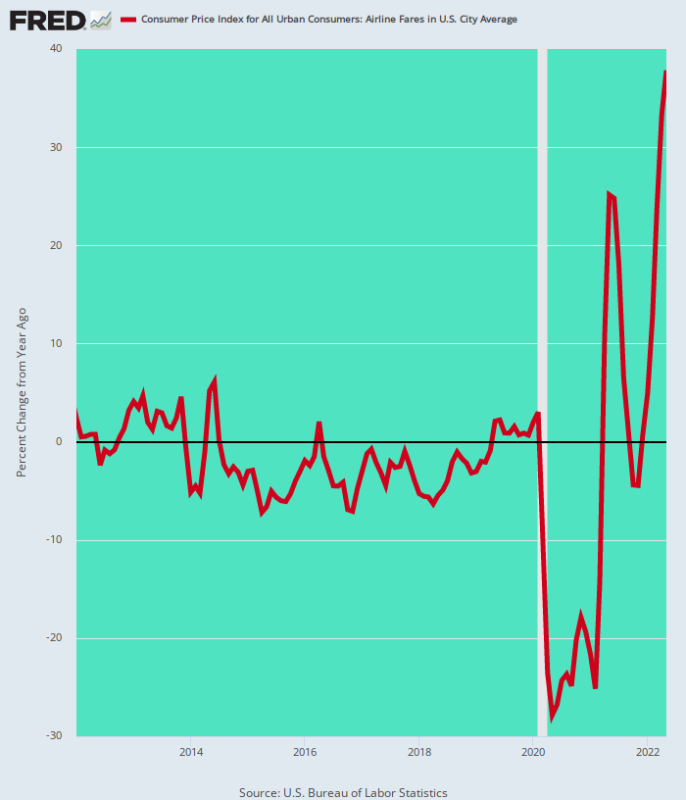
Right. But what is way up now is ticket prices. After plunging by -28% in May 2020 under Fauci’s benighted orders, May prices soared by +38% on a year-over-year basis.
Again, what we have is an economy careening lower and then higher owing to massive and unnecessary government interventions. And in the case of energy, which we take up in Part 2, the mayhem is even more severe.
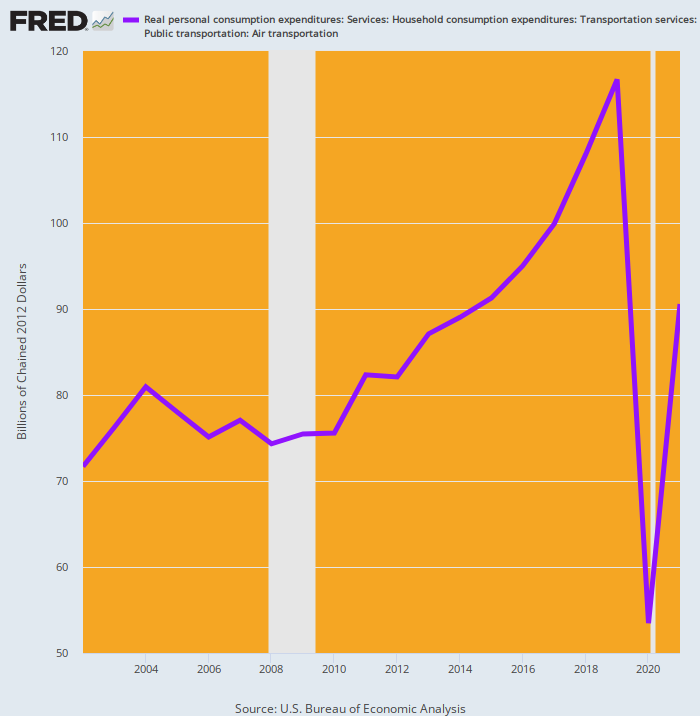
For want of doubt, however, here is the inflation-adjusted level of airline personal consumption expenditures in recent years. In 2020, the proverbial trap-door literally opened up under the industry. Real output fell by $62.3 billion or 52%, then rebounded by 63% the following year.
That’s surely some kind of destructive economic yo-yo. And it was all fueled by the Washington politicians and apparatchiks who have no clue that America’s grand $24 trillion economy is not some kind of glorified game of bumper cars.
Real PCE for Air Transportation, 2002-2021
Published under a Creative Commons Attribution 4.0 International License
For reprints, please set the canonical link back to the original Brownstone Institute Article and Author.


