
The USA and its 50 state jurisdictions provide a natural experiment to test whether excess all-cause deaths can be directly attributed to implementing the social and economic structural large-scale changes induced by ordering general-population lockdowns.
Ten states had no lockdown impositions and there are 38 pairs of lockdown/non-lockdown states that share a land border. We find that the regulatory imposition and enforcement of statewide shelter-in-place or stay-at-home orders conclusively correlates with larger health-status-corrected, per capita, all-cause mortality by state. This result is inconsistent with the hypothesis that lockdowns saved lives.
Introduction
On March 11, 2020, the World Health Organization declared a pandemic based on a reported outbreak in Wuhan, China of COVID-19 (hereafter COVID), the respiratory illness purportedly caused by the SARS-CoV-2 virus. On March 13, 2020 a national emergency was declared in the United States concerning the COVID-19 outbreak. In the US, this declaration resulted in a heterogeneous set of responses from health authorities and government officials in various states. Among those varied, state-wise policy responses, most states issued shelter-in-place or stay-at-home orders in March and April of 2020 (hereafter referred to as “lockdowns”).
The motivation for these lockdown measures was to slow the spread of COVID-19 by limiting social interactions, under the assumption that the disease spreads by person-to-person contact. However, due to the independence of state governance in the US, the lockdown measures had a wide range of implementation and enforcement, with some states foregoing lockdowns altogether.
These differences in state-wise decisions to either lock down or not thus establish a useful experiment to test the hypothesis that lockdowns saved lives. This hypothesis predicts that there should have been fewer deaths (per capita) in states that implemented lockdowns, and more deaths in states that did not, after adjusting for differences in the health status of the state populations, if all other factors are presumed to have lesser impact. The data available to test these predictions can be found in all-cause mortality (ACM) by time and by state, reported by the CDC.
As demonstrated by other investigators (for example Rancourt, Baudin & Mercier 2021), ACM sidesteps the difficult issue of cause-of-death assignation, which is political in nature, and as a result susceptible to bias (e.g. Ealy et al. 2020). The correct dominant cause of death is rarely known in the case of respiratory illnesses, and the death is normally not monocausal.
The advantage of analyzing ACM is that deaths in the US are recorded with high fidelity (no reporting bias or underreporting). Once recorded, a death is a death, regardless of how the cause is assigned on the death certificate. If lockdowns are effective in preventing deaths due to the spread of a disease during a pandemic, then regions that implemented lockdowns should have experienced fewer per capita deaths from all causes, if there are no overriding confounding factors.
Data and Methodology
Our goal is to assess the efficacy of lockdowns in saving lives during the COVID era by comparing the total number of deaths from all causes in pairs of states: one state with a lockdown, and a state without a lockdown that shares a border with the lockdown state. We also examined the lockdown states that do not share a border with any non-lockdown state, for completeness.
We identified non-lockdown states by examining administrative and executive orders issued during March-April 2020 by state governments in response to the pandemic declarations of the WHO and of federal and state governments. Most of these orders have been archived at the website Ballotpedia.com, and we located the orders for which the links were no longer valid by searching state government websites. We assigned a “stringency” score to each executive order based on the language of the lockdown order for the citizens of the state:
Ordered/mandated: 3
Directed: 2
Suggested/encouraged: 1
No order: 0
We found that there were seven (7) states that had scores of 0 because they did not issue stay-at-home orders: North Dakota, South Dakota, Wyoming, Iowa, Oklahoma, Nebraska, and Arkansas. There were an additional three (3) states that had scores of 1 because the governments only suggested or encouraged citizens to stay at home, but did not require them to do so, nor provided means of enforcement: Utah, Kentucky and Tennessee.
Our criterion for lockdown versus non-lockdown states differs from previous studies in its simplicity (i.e. focusing only on the stringency of the language in the executive orders). But our resulting list of non-lockdown states includes all seven states listed as non-lockdown on Ballotpedia, and includes all four non-lockdown states identified by the CDC-sponsored study of Moreland et al. (2020).
We compared the outcomes of these ten non-lockdown states with lockdown states that share a border, under the assumption that viral spread is not impeded by state boundaries. In this study we focus on the total all-cause mortality (ACM) over a specified time period as the metric of lockdown efficacy. We use three time periods as described below.
We downloaded comma-separated-value (csv) files containing ACM per week for each state from the CDC Wonder website. We divided the weekly ACM data for each state by that state’s population (US Census, April 1, 2020), resulting in the number of deaths per capita, per week (Dpcw). Throughout this report we express Dpcw as the number of deaths per 10,000 residents.
An additional correction step is necessary to allow for accurate state-by-state comparisons of mortality. Differences in age distributions, obesity rates, poverty levels, physical and mental disability rates, and other health determinants will lead to intrinsic differences in Dpcw in various states. These differences collectively manifest in an offset in Dpcw seen during non-pandemic years (prior to 2020).
For example, Figure 1 shows a comparison of the Dpcw between New York and Florida during the years 2014-2020. As with all state-wise comparisons, New York and Florida have remarkably similar temporal variations in Dpcw from week to week and from year to year, yet also have a clear and nearly constant offset.
We correct for this offset by computing a factor Hstate, which is the median value of the ratio of a state’s Dpcw and the Dpcw of a reference state from January 1, 2014 through December 31, 2020. We chose New York as a reference state for computing Hstate. This choice of reference state is arbitrary, but the large population of New York means that, in most cases, the error in Hstate is dominated by Poisson errors in the Dpcw of the state of interest.
In the example shown in Figure 1, the health-status correction factor of Florida is Hstate = 0.537, indicating that New York experienced 53.7% fewer Dpcw than Florida in the years 2014 to 2020, likely owing in part to the older population in Florida. For each state-wise comparison of Dpcw we adopt this ratio as a correction factor to bring the pair of states onto the same scale, allowing for a health-status-corrected comparison of mortality during the pandemic period.
This health-status correction factor is justified since we are performing a differential comparison between states with and without lockdowns. We are asking, “Following the enactment of lockdown measures, what is the fractional difference between the adjusted per capita ACM in each pair of states?” This assumes that after removing differences in the health status of the populations of neighboring states, the largest effect on the adjusted per capita ACM was the enactment of a lockdown. This assumption is justified given that the lockdowns are expected to result in massive disruptions to national and regional economies, healthcare systems, and general social fabric.
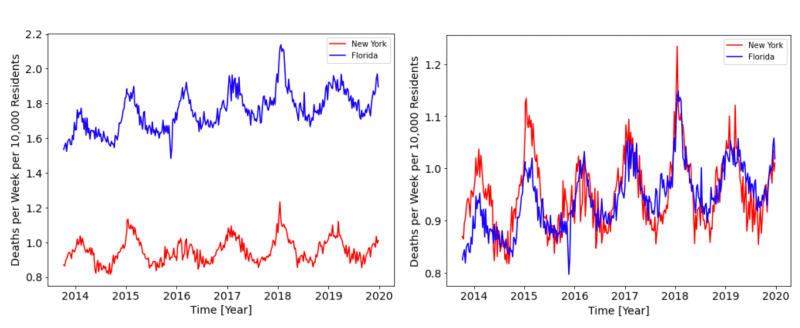
Figure 1: The deaths per capita, per week (Dpcw) in Florida (blue) and New York (red). The left-hand panel shows the offset in Dpcw, which we attribute to differences in each state’s population health status (age structure, poverty level, obesity rate, etc.). The panel on the right shows the corrected Dpcw, which allows for a differential comparison between these two states from 2020 onward.
To quantify the effect of lockdowns on mortality during the COVID period we calculate the integrated (total) health-status-corrected deaths per capita, Dtot, over a chosen time period. We then compute the ratio of Dtot for each pair of states, denoted by R (lockdown divided by non-lockdown). We use three different time periods over which we expect Dtot, and R, to capture the effects of the lockdown measures:
Dtot,1: Sum over lockdown period of the lockdown state.
Dtot,2: Sum over the period of “COVID peak 1” (cp1) as identified by Rancourt et al. (2021; week 11 through week 25 of 2020)
Dtot,3: Sum over entire period from March 11, 2020 to December 31, 2021
Throughout this paper we report the 95% confidence intervals for our integrated, population-normalized and health-status-corrected mortality ratios for each pair-wise comparison of lockdown and non-lockdown states, and for the health-status-corrected integrated per capita mortalities that we report. These confidence intervals are calculated under the assumption that the dominant source of error comes from counting statistics.
Results
Our results are summarized in the figures below.
In Figures 2, 3, and 4, the y-axis lists all 38 lockdown/non-lockdown pairs of states used for comparing mortality outcomes, with the lockdown state listed first, followed by the non-lockdown state. The blue dots show the point-estimate of the ratio, R, and the associated error bars show the 95% confidence interval; the vertical dashed line marks unity. Values to the left of the vertical line indicate instances in which the lockdown state experienced fewer health-status-corrected per capita deaths than the non-lockdown state. Values to the right of the line indicate that the lockdown state experienced more health-status-corrected per capita deaths than the non-lockdown state.
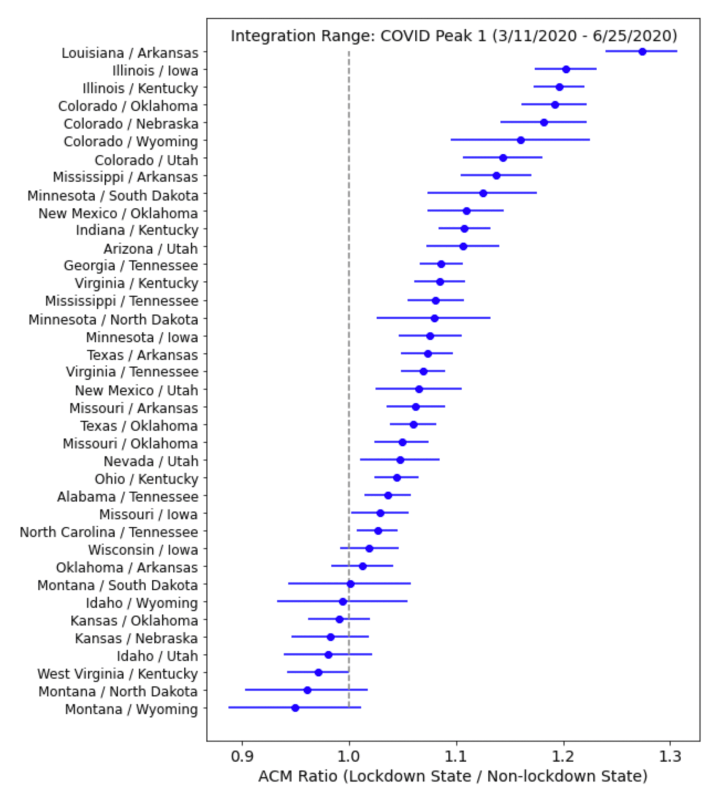
Figure 2: The health-status adjusted per capita ACM ratio (R) for each neighboring pair of states listed on the y-axis. The ratio is based on summing all deaths in each state over the time period corresponding to the COVID peak (3/11/2020 – 6/24/2020). The error bars show the 95% confidence interval for each pair’s ratio. Ratios to the left of the vertical line indicate that fewer deaths occurred in the lockdown state than in the non-lockdown state, while ratios to the right of the vertical line indicate that states with lockdowns experienced more deaths.
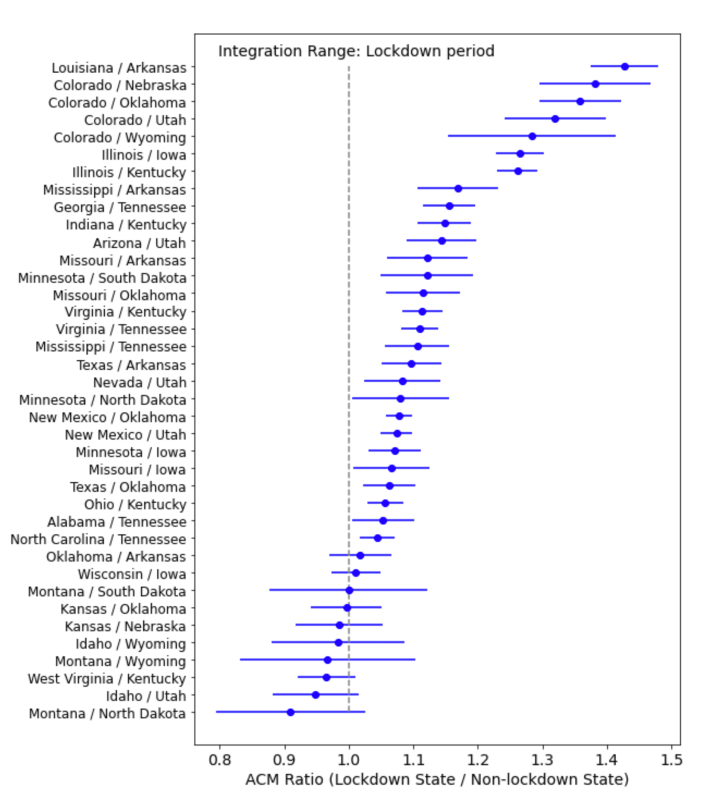
Figure 3: The health-status adjusted per capita ACM ratio (R) for each neighboring pair of states listed on the y-axis. The ratio is based on summing all deaths in each state over the time period corresponding to the lockdown state’s lockdown duration. The error bars show the 95% confidence interval for each pair’s ratio. Ratios to the left of the vertical line indicate that fewer deaths occurred in the lockdown state than in the non-lockdown state, while ratios to the right of the vertical line indicate that states with lockdowns experienced more deaths.
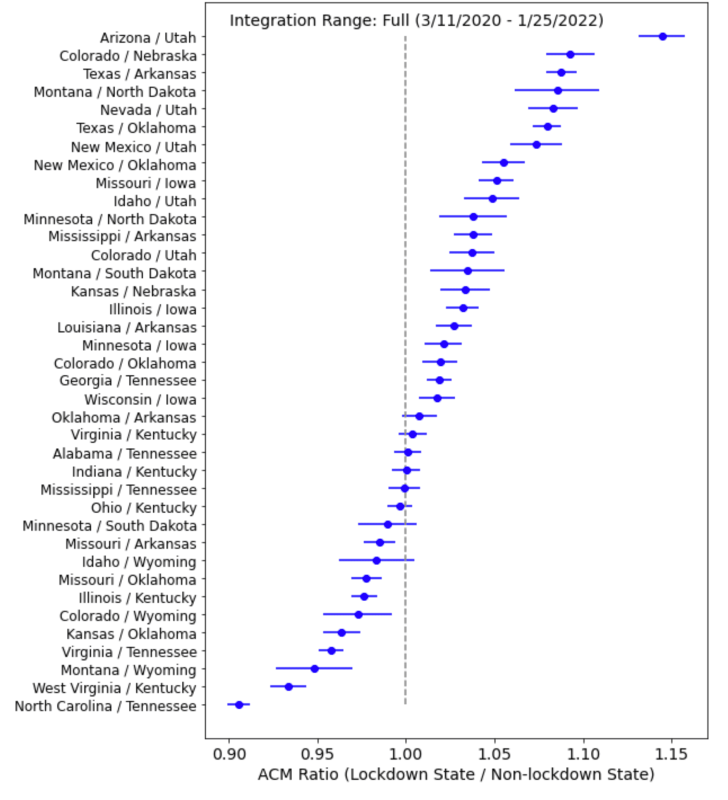
Figure 4: The health-status adjusted per capita ACM ratio (R) for each neighboring pair of states listed on the y-axis. The ratio is based on summing all deaths in each state over the full “COVID Era” in our data set (March 11, 2020 – Jan 25, 2022). The error bars show the 95% confidence interval for each pair’s ratio. Ratios to the left of the vertical line indicate that fewer deaths occurred in the lockdown state than in the non-lockdown state, while ratios to the right of the vertical line indicate that states with lockdowns experienced more deaths.
If lockdowns saved lives, then we would expect that most of the ACM ratios (R) would be less than one. Instead, we see the opposite. For all three integration periods, the majority of ratios are larger than one. For the cp1 (lockdown, full) period, 28 (28, 21) pairs have ACM ratios (R) larger than one, while 0 (0, 9) pairs have ratios less than one, and the remaining 10 (10, 8) pairs have R indistinguishable from unity at 95% confidence.
Thus, our analysis of R values for three time periods during which lockdowns are expected to have an effect shows that the ACM data from the past two years is inconsistent with the hypothesis that lockdowns saved lives. On the other hand, our results are consistent with the conclusion of Rancourt et al. (2021) that the excess deaths in the COVID period in the USA are caused by the government and medical measures, and responses to the declared pandemic.
Figure 4 shows the health-status-corrected integrated deaths per capita for the 15-week “COVID peak 1” period (cp1; weeks 11 through 25 of 2020) for all the states individually (red) and for the same 15-week integration window in 2019 (blue) and 2018 (green). Here, the states are ordered, top to bottom, in decreasing order of average state-wise population density, which is often presumed to be a factor in the spread of a contagious disease. The state names in magenta correspond to our ten non-lockdown states having lockdown stringency scores of 0 or 1. The state names in cyan are the lockdown states that share a border with a non-lockdown state, which we used in our calculation of R.
The values of health-status-corrected integrated all-cause mortality in the 15-week “cp1” periods of 2019 and 2018 are tightly constrained for all states to a value of approximately 14 deaths per 10,000 (Figure 5), whereas the corresponding values in the COVID period are widely different from state to state, ranging from the 2019 baseline value to as high as 25 per 10,000 for New Jersey, and being typically as large as 15 to 21 per 10,000. Non-lockdown states have names on the y-axis colored magenta, while the lockdown states used as our comparands in calculating R are colored cyan.
Figure 5 shows that most of our ten non-lockdown states have health-status-corrected integrated all-cause mortality in the 15-week cp1 on the pre-COVID (2018 and 2019) baseline value of approximately 14 per 10,000, whereas most of the states with lockdown stringency scores of 2 and 3 have mortality rates well above the pre-COVID baseline values.
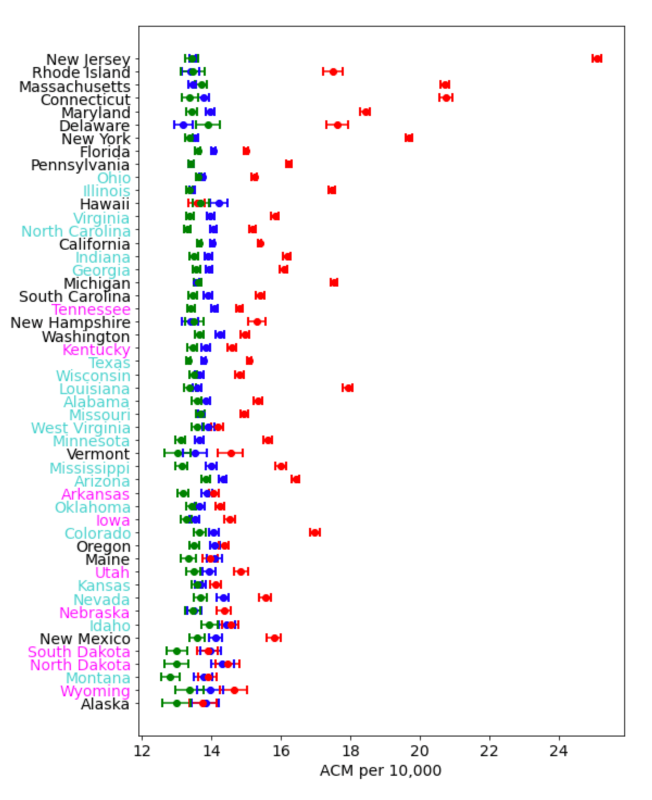
Figure 5: Integrated health-status corrected ACM over the cp1 period (March 11-June 29 2020; red) compared to the same time period in 2019 (blue) and 2018 (green). States ordered from top to bottom in decreasing population density. Magenta indicates non-lockdown states while cyan denotes lockdown states that share a border with non-lockdown states.
While a precise estimation of the excess mortality due to lockdowns is beyond the scope of this paper, we can make a rough estimate based on Figure 5. The three most populous states (California, Texas, Florida) have above-baseline COVID-period increases of approximately 1 per 10,000. On the basis of one calendar year (52 weeks), and for a population equal to that of the entire USA, this would correspond to approximately 110,000 deaths, which could be attributed directly to the impacts of ordering lockdowns and which would not have occurred if lockdowns had not been implemented. This value is consistent with the lockdown excess mortality estimate of 97,000/year by Mulligan & Arnot (2022).
Discussion and Conclusion
The use of lockdowns to “quarantine” the general population of the United States in order to control the spread of an infectious disease is without precedent in the nation’s history. During previous pandemics, only the sick and infirm were quarantined while the rest of the population continued more or less as normal.
This “focused protection” approach was recommended by medical professionals in the Great Barrington Declaration in 2020, demonstrating that alternatives to lockdowns existed and were well understood within the medical community. As recently as 2019 the World Health Organization advocated a similar approach in its recommendations for mitigating the risks of an influenza pandemic while making no mention of lockdown measures for the general population (WHO 2019). Indeed, the WHO report specifically states that quarantining exposed individuals is “not recommended because there is no obvious rationale for this measure” (see their Tables 1 and 4). Similarly, the Influenza pandemic preparedness action plan for the United States makes no mention of lockdowns and states that “…classical measures designed to reduce the risk of introduction and transmission of some infectious agents, such as clinical screening and quarantine at ports of entry, are not likely to be effective” (Strikas et al. 2002).
In their review of the available literature on influenza pandemic interventions, Inglesby et al. (2006) explicitly recommend against quarantine measures in the event of an influenza pandemic, for both sick and healthy individuals, because the societal costs are expected to far outweigh the benefits. They concluded, “[E]xperience has shown that communities faced with epidemics or other adverse events respond best and with the least anxiety when the normal social functioning of the community is least disrupted.” These recommendations extend beyond preparing for and responding to influenza pandemics. In a report titled Preparedness for a High-Impact Respiratory Pathogen Pandemic, the authors conclude that quarantine is among the least effective nonpharmaceutical measures in containing disease spread (Johns Hopkins Center for Health Security 2019).
Thus, the lockdown measures implemented in 2020 by the majority of US states, as well as many countries worldwide, represented an unprecedented, large-scale experiment in infectious disease control. The all-cause mortality data we have analyzed allows us to test the hypothesis that lockdowns saved lives during the COVID pandemic. We find that these data are inconsistent with this hypothesis; states with lockdowns experienced more all-cause deaths than neighboring states without lockdowns. We therefore conclude that this experiment was a failure of public health policy and that lockdown measures should not be used during future disease outbreaks.
Our finding that all-cause mortality increased in states with lockdowns is consistent with the conclusions of Agrawal et al. (2021) who found statistically significant increases in excess mortality due to shelter-in-place orders in the US and in 43 countries. Similarly, Mulligan & Arnot (2022) estimate that there were 97,000/year excess deaths due to lockdowns, with excess mortality distributed equally among all adult age groups, unlike COVID deaths which were most commonly attributed among the elderly.
Given the strong association between general-population lockdown impositions and increased all-cause mortality, demonstrated above (Figures 2-5), it is appropriate to venture hypotheses for the cause or causes of this association.
Obviously, privileged Americans from the upper-middle and professional classes did not die from staying at home. However, it is not unreasonable to postulate that the general-population lockdown regulations and orders are nonetheless proxies or statutory indicators of the degree of aggressiveness (including abandonment) with which the societal institutions in the state responded or reacted to the announced pandemic. These institutions would include schools, care homes, hospitals, clinics, disability services, day care facilities, police services, family and social services, and so on.
We tentatively advance this because it is entirely likely that the excess deaths associated with lockdowns are from pools of individuals at particularly high risk of suffering fatal consequences from large and negative disruptions in their lives and support networks. This will be true irrespective of the actual mechanistic cause of death, given the known association between both experienced stress and social isolation and disease severity and mortality, via the impact on the immune system (Ader and Cohen 1993; Cohen et al. 1991; Cohen et al. 1997; Cohen et al. 2007; Sapolsky 2005; Prenderville et al., 2015; Dhabhar 2014; Rancourt et al. 2021). Indeed, there is ample evidence that the lockdowns are associated with large increases in unemployment and a general worsening of mental health (e.g. Jewell et al. 2020, Czeisler et al. 2020).
The ACM data available through the CDC Wonder website is not disaggregated by both state and demographics, so we were not able to examine which demographic groups were dying, and how they were dying, in each state. However, demographic information is available on a national level, and Mulligan & Arnot (2022) found large increases in excess mortality among people ages 18-65 years, which is a demographic that was not at high risk from COVID.
Similarly, Rancourt et al. (2021) found that the temporal and spatial distribution of all-cause mortality in the pandemic period is inconsistent with the effects of a viral respiratory disease. They found evidence that many excess deaths during the pandemic were misdiagnosed bacterial pneumonia infections, likely exacerbated by disruptions to the US healthcare system.
Thus, there exists strong evidence supporting the hypothesis that lockdowns placed a sudden and severe stress burden on vulnerable demographics in the US, leading to significant increases in death in those states that used lockdowns as disease control measures.
This summary is drawn from the authors’ larger study.
Join the Conversation
Published under a Creative Commons Attribution 4.0 International License
For reprints, please set the canonical link back to the original Brownstone Institute Article and Author.